使用MMDetection训练自己的数据集
使用MMDetection训练自己的数据集
- 前言
- 1、配置文件修改
-
- 1.1 model部分
- 1.2 dataset部分
-
- 1.2.1 train dataset部分
-
- 训练部分数据增强
- train dataset后续
- 1.2.2 dataset后续
- 1.3 其他部分
- 2、绘制训练损失图
- 总结
前言
本文主要阐述如何使用mmdetection训练自己的数据,包括配置文件的修改,训练时的数据增强,加载预训练权重以及绘制损失函数图等。这里承接上一篇文章,默认已经准备好了COCO格式数据集且已安装mmdetection,环境也已经配置完成。
1、配置文件修改
首先就是根据任务选定一个训练模型,这里我选用yolox-s作为我的训练模型,进入mmdetection/configs/yolox文件夹,可以看到有以下文件:
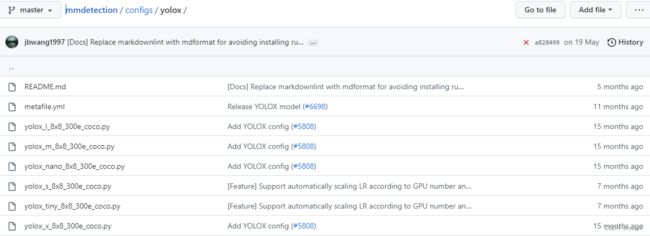
这里可以看到有yolox-s的配置文件yolox_s_8x8_300e_coco.py,这里请注意:不要在默认的配置文件中修改内容,最好将要修改的配置文件复制一份,在副本文件中修改内容!!! 复制一份配置文件之后,就可以根据需要进行修改了!
1.1 model部分

这里大部分参数可以沿用默认的,或许有修改的是bbox_head中的num_classes=80,这个是类别数,COCO数据集是80类,你可以看自己数据集是多少类别,然后改成对应的,比如我的数据集有2类,那么就改成num_classes=2。
另外就是test_cfg下的nms=dict(type='nms', iou_threshold=0.65),iou_threshold=0.65可以修改,你可以把iou阈值改成你想要的,比如iou_threshold=0.40。
如果想使用预训练权重,那么可以这样设置,就是在model字典开头,加上init_cfg=dict(type='Pretrained', checkpoint='这里输入你的预训练权重文件路径')
一些分类头和FPN的修改和BackBone的替换并不在本文之内。
1.2 dataset部分
在mmdetection文件夹中创建data文件夹,将你的训练、验证、测试数据导入其中。然后在下列填入你的数据集路径:

比如:
data_root = 'data/cats_dogs'
dataset_type = 'Cats_Dogs'
这里看到有个dataset_type,也就是数据集类型,这个自己定义一些比较方便,具体操作如下:
- 进入
mmdetection/mmdet/datasets,像之前一样,把coco.py复制一份,我们要修改其内容(这里我们默认数据集格式是COCO)

- 打开复制的
coco.py我将其命名为cats_dogs.py,然后只需把23行的COcoDataset(CustomDataset)改成Cats_Dogs(CustomDataset),然后把25行CLASSES改成你自己的类别,我的数据集是猫和狗,那我就改成了CLASSES = ('cat', 'dog')。请注意:这里类别的名字得和你的图片目标标签名字一样,别你的标签是 Cat和Dog,然后在这里变成了 cat和dog!!! 其他的地方都不需要动!!!
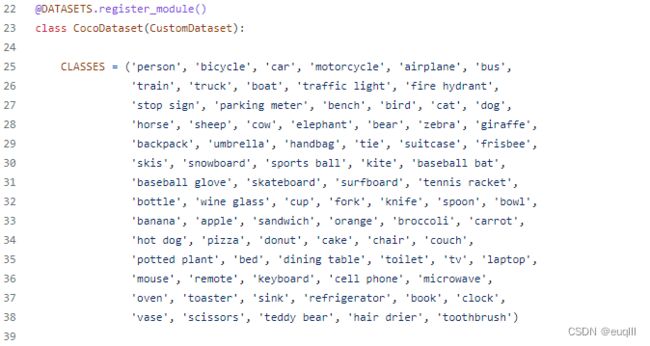

- 把定义好的
cats_dogs.py加到注册文件mmdetection/mmdet/datasets/__init__.py中,添加方式请参考我画红线部分。

这样dataset初步构建完成,下面针对train dataset进行修改
1.2.1 train dataset部分
训练部分数据增强
说起train dataset肯定离不开数据增强,我这里没有使用mmdetection内置的数据增强,如果你想看其内置哪些增强,可以在mmdetection/mmdet/datasets/pipelines/transforms.py中查看。我这里使用albumentations库进行数据增强(主要是功能真的很强大,太香了),如果你也想使用这个开源库,那么请先安装它:
pip install -U albumentations
然后在train_pipelines添加或修改你的增强策略。具体可以参考我的代码:
- 首先在配置文件开头添加如下代码:
 ###    Albumentations Start    ###
img_norm_cfg = dict(
    mean=[95.4554, 107.3959,  69.8863], std=[56.0811, 55.2941, 55.2364], to_rgb=True)
albu_train_transforms = [
    dict(
        type='RandomBrightnessContrast',
        brightness_limit=[-0.2, 0.3],
        contrast_limit=[-0.2, 0.3],
        p=0.5),
    dict(type='RandomRotate90', p=0.5),
    dict(type='GaussianBlur', blur_limit=(3, 7), sigma_limit=(0, 0.99), p=0.5),
    dict(type='MotionBlur', blur_limit=(3, 7), p=0.5)
]
###    Albumentations End    ###
type='RandomBrightnessContrast',type='RandomRotate90' 都是增强策略,这个可以查看albumentations官方文档,根据自己需求添加,添加格式和我上面的代码一样。
然后 mean=[95.4554, 107.3959, 69.8863], std=[56.0811, 55.2941, 55.2364] ,这个是你数据集的均值和标准差,可以自己编写一个Python程序自动计算一下,如果你懒得编写,那么可以参考我的这个,就是计算起来稍微有点慢。
import torch
from torch.utils.data import DataLoader, Dataset
import os
from pathlib import Path
import numpy as np
from PIL import Image


def cal_mean_std(path: str):
    channels_sum, channels_squared_sum, nums = 0, 0, 0
    path_list = os.listdir(path)
    for img_path in path_list:
        image_path = os.path.join(path, img_path)
        # image = torch.from_numpy(np.array(Image.open(image_path)) / 255).permute([2, 0, 1]).float()
        image = torch.from_numpy(np.array(Image.open(image_path))).permute([2, 0, 1]).float()
        channels_sum += torch.mean(image, dim=[1, 2])
        channels_squared_sum += torch.mean(image**2, dim=[1, 2])
        nums += 1
    mean = channels_sum / nums
    std = (channels_squared_sum / nums - mean**2)**0.5
    return mean, std


if __name__ == '__main__':
    path = os.path.abspath("F:/VOC2012/VOCdevkit/VOC2012/JPEGImages")
    mean, std = cal_mean_std(path=path)
    print(f'mean : {mean}, std : {std}')
到这里train_pipelines添加完成
train dataset后续
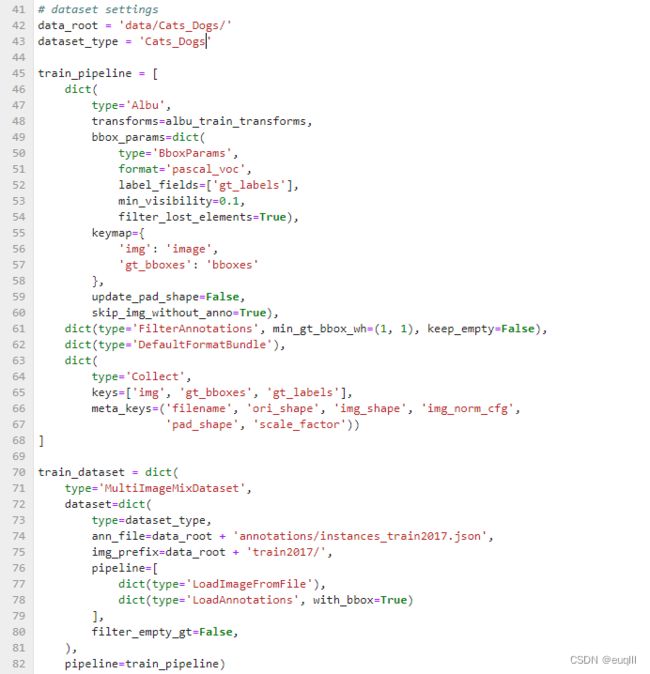
作完数据增强后就应该将其添加到train_dataset中了,照我这样添加就好了:
train_pipeline = [
    dict(
        type='Albu',
        transforms=albu_train_transforms,
        bbox_params=dict(
            type='BboxParams',
            format='pascal_voc',
            label_fields=['gt_labels'],
            min_visibility=0.1,
            filter_lost_elements=True),
        keymap={
            'img': 'image',
            'gt_bboxes': 'bboxes'
        },
        update_pad_shape=False,
        skip_img_without_anno=True),
    dict(type='FilterAnnotations', min_gt_bbox_wh=(1, 1), keep_empty=False),
    dict(type='DefaultFormatBundle'),
    dict(
        type='Collect',
        keys=['img', 'gt_bboxes', 'gt_labels'],
        meta_keys=('filename', 'ori_shape', 'img_shape', 'img_norm_cfg',
                   'pad_shape', 'scale_factor'))
]

train_dataset = dict(
    type='MultiImageMixDataset',
    dataset=dict(
        type=dataset_type,
        ann_file=data_root + 'annotations/instances_train2017.json',
        img_prefix=data_root + 'train2017/',
        pipeline=[
            dict(type='LoadImageFromFile'),
            dict(type='LoadAnnotations', with_bbox=True)
        ],
        filter_empty_gt=False,
    ),
    pipeline=train_pipeline)
1.2.2 dataset后续
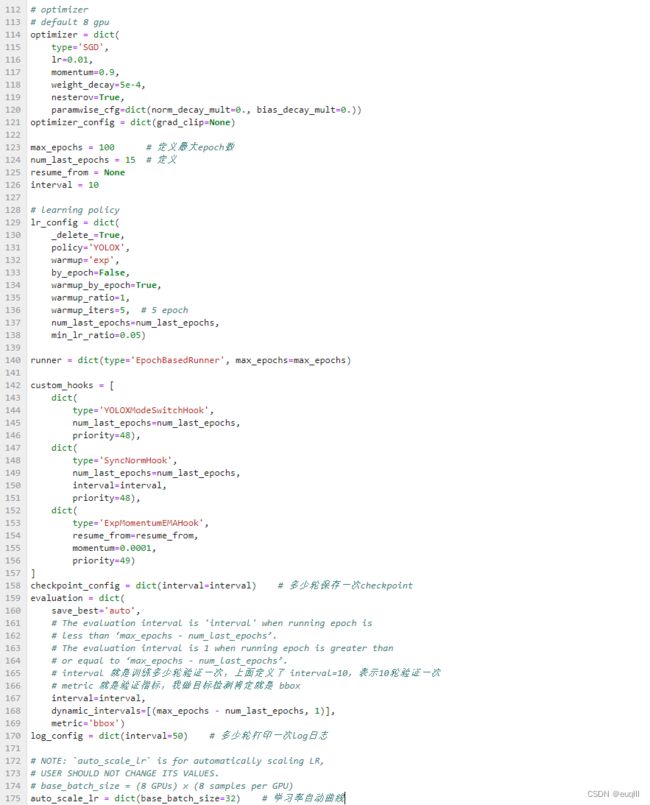
dataset的其他部分如下所示,修改的地方并不多,samples_per_gpu=16说的是单张GPU的batch size,这个看你GPU显存大小了,数值大占显存就多,数值过小就训练不佳;worker_per_gpu=1表示线程数,这个看你CPU的数量了,你要是有15个,那就设15,榨干服务器性能。
1.3 其他部分
其他部分无外乎就是学习率、优化器、迭代次数,多少轮验证一次等等
这里全部弄完之后,就能开始训练了
python tools/train.py configs/yolox/yolox_s_peach_coco.py --auto-scale-lr
2、绘制训练损失图
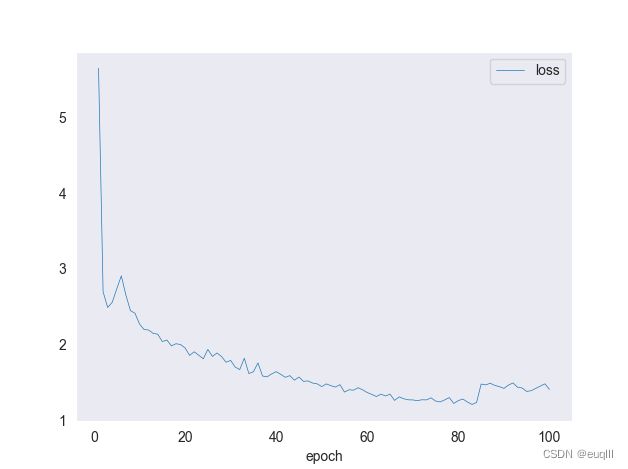
按照上述训练完成之后,会在mmdetection文件夹下生成一个叫做work_dirs的文件夹,里面存放着训练日志、训练模型的权重、配置文件。绘制train loss图的话,我们用到的是以.log.json结尾的文件。
输入这行命令:
python tools\analysis_tools\analyze_logs.py plot_curve yolox.log.json --keys loss --start-epoch 1 --eval-interval 10 --legend loss
–eval-interval 是多少轮验证一次,请和训练配置文件设置一致
运行之后如果你得到了这样的错误信息,list index out of range,列表越界问题
不要担心,请按我下面的代码。替换analyze_loss.py中的def plot_curve(log_dicts, arg)函数:
def plot_curve(log_dicts, args):
    if args.backend is not None:
        plt.switch_backend(args.backend)
    sns.set_style(args.style)
    # if legend is None, use {filename}_{key} as legend
    legend = args.legend
    if legend is None:
        legend = []
        for json_log in args.json_logs:
            for metric in args.keys:
                legend.append(f'{json_log}_{metric}')
    assert len(legend) == (len(args.json_logs) * len(args.keys))
    metrics = args.keys

    num_metrics = len(metrics)
    for i, log_dict in enumerate(log_dicts):
        epochs = list(log_dict.keys())
        for j, metric in enumerate(metrics):
            print(f'plot curve of {args.json_logs[i]}, metric is {metric}')
            if metric not in log_dict[epochs[int(args.eval_interval) - 1]]:
                if 'mAP' in metric:
                    raise KeyError(
                        f'{args.json_logs[i]} does not contain metric '
                        f'{metric}. Please check if "--no-validate" is '
                        'specified when you trained the model.')
                raise KeyError(
                    f'{args.json_logs[i]} does not contain metric {metric}. '
                    'Please reduce the log interval in the config so that '
                    'interval is less than iterations of one epoch.')

            if 'mAP' in metric:
                xs = []
                ys = []
                for epoch in epochs:
                    ys += log_dict[epoch][metric]
                    if 'val' in log_dict[epoch]['mode']:
                        xs.append(epoch)
                plt.xlabel('epoch')
                plt.plot(xs, ys, label=legend[i * num_metrics + j], marker='o')
            else:
                xs = []
                ys = []
                num_iters_per_epoch = log_dict[epochs[0]]['iter'][-1]
                for epoch in epochs:
                    iters = log_dict[epoch]['iter']
                    if log_dict[epoch]['mode'][-1] == 'val':
                        iters = iters[:-1]
                    # xs.append(
                    #     np.array(iters) + (epoch - 1) * num_iters_per_epoch)
                    xs.append(np.array([epoch]))
                    ys.append(np.array(log_dict[epoch][metric][:len(iters)]))
                xs = np.concatenate(xs)
                ys = np.concatenate(ys)
                # plt.xlabel('iter')
                plt.xlabel('epoch')
                plt.plot(
                    xs, ys, label=legend[i * num_metrics + j], linewidth=0.5)
            plt.legend()
        if args.title is not None:
            plt.title(args.title)
    if args.out is None:
        plt.show()
    else:
        print(f'save curve to: {args.out}')
        plt.savefig(args.out)
        plt.cla()
总结
本文讲述了配置文件的修改和数据增强的添加,另外对绘制损失函数图会出现的一个问题进行了解决,欢迎大家提供不同意见,共同学习!


