ComplexHeatmap包绘制热图(二)
前面我介绍了如何利用ComplexHeatmap包绘制简单的热图,现在我们绘制一个稍微复杂一些的热图
首先还是配置数据
data=matrix(rnorm(100),nrow=10)
colnames(data)=paste0('sample',1:10)
rownames(data)=paste0('gene',1:10)
head(data)
anno_row=as.matrix(1:10)
rownames(anno_row)=paste0('gene',1:10)
colnames(anno_row)='bar_data'
anno_row
p1=Heatmap(data,
           col=c('blue','white','red'),
           cluster_rows = TRUE,
           cluster_columns = TRUE,
           name='expression',
           column_title = "samples",
           column_title_side="bottom")
p2 = rowAnnotation(width = unit(2, "cm"),
                   bar_data = anno_barplot(anno_row,
                                          border = FALSE,
                                          axis = TRUE,
                                          gp = gpar(fill = "grey50",
                                                    col = "white"),
                                          bar_with = 0.8,
                                          baseline=0))
p1+p2
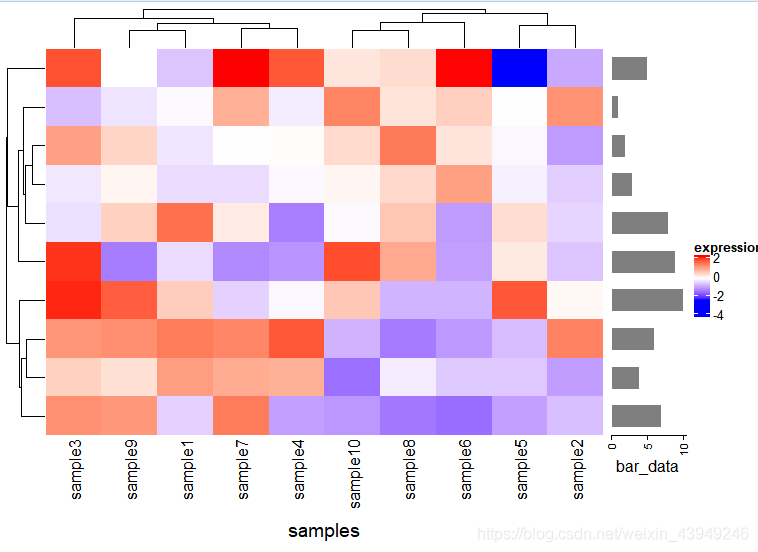
 这时候绘制的热图加bar图已经出现原形了
但是我也发现行名无法显示,这时候我们可以在p1的左侧加一个标签,或者是P2的右侧加一个文本
左侧加标签
left_anno=data.frame(gene_id=rownames(data))
left_annos = HeatmapAnnotation(df = left_anno,which = "row")
p1=Heatmap(data,
           col=c('blue','white','red'),
           cluster_rows = TRUE,
           cluster_columns = TRUE,
           name='expression',
           column_title = "samples",
           column_title_side="bottom",
           left_annotation=left_annos)
p2 = rowAnnotation(width = unit(2, "cm"),
                   bar_data = anno_barplot(anno_row,
                                          border = FALSE,
                                          axis = TRUE,
                                          gp = gpar(fill = "grey50",
                                                    col = "white"),
                                          bar_with = 0.8,
                                          baseline=0))
p1+p2
p1=Heatmap(data,
           col=c('blue','white','red'),
           cluster_rows = TRUE,
           cluster_columns = TRUE,
           name='expression',
           column_title = "samples",
           column_title_side="bottom",
           left_annotation=left_annos)
p2 = rowAnnotation(width = unit(2, "cm"),
                   bar_data = anno_barplot(anno_row,
                                          border = FALSE,
                                          axis = TRUE,
                                          gp = gpar(fill = "grey50",
                                                    col = "white"),
                                          bar_with = 0.8,
                                          baseline=0))
p3=rowAnnotation(text = row_anno_text(rownames(data)),
                 width = max_text_width(rownames(data)))
p1+p2+p3


