catboost 的实例应用附带特征重要度打印
背景:
解决问题:对类别特征使用catboost,观察其特征重要程度。
今天搜索catboost的实例应用的博客,该博客的样例、demo、以及特征重要度打印,这三个内容,都是我想使用的。可是,他收费了,碰见我这个身无分文的人,大抵是不能看了。我相信,想要的信息总是可以在互联网上找到,只是时间问题罢了。经过搜集整理, 汇总如下。(本篇先不说原理,先将demo跑起来,原理篇周末再更)
1.数据样例
把数据放在当前目录下data文件夹下的test文本中,数据我简单做了一些加工,可能看着有点怪,不用懂他们的意思,只需要知道数据格式是这个 样子就好,格式如下,第一了是label,剩下的每一列是一维特征,用'\t'分割。
0   6663435  10055   资深运营视   设计  IT   17150989   1951408   IT   产品  产品经理    3487
0   6677198  13868   专员  人事 IT   7471671   17191119   IT   研发  研发   9634
0   6501035  9181    用户中心    研发  IT   30461    351185   IT   研发  Unity开发  11193
0   985633  15776   制片  制片  文化传媒业   3880313   337578   交通物流业   调度    办事员 4971140
0   9058494  8538    数据   数据分析    IT   173960855   34691004   IT   研发  大数据开发    48
1   98790  0       其他  IT   01358 3395398   学生  关注IT/    实习生 10055
0   7499635  5839593    教务主管    校长/教务管理 教行业  34471341   3457416   教行业      公司职员    9535
0   169035759  938    云计算 研发  IT   879508   338347   IT   研发  前端开发实习生 687
0   836809  0   执行董事    企业高管    医疗业  1691 1006003   IT   企业高管    创始人 0
1   9160655  3747   材料科学 其他  学生  3543173   758109   IT   研发  软件开发 179563
1   9999806  1   负责人   运营  IT   58411   6455997    IT   测试  高级测试 11016
0   169034189  0   业务总监    销售  制造业 9399495    18514071   制造业 生产管理    常经理  0
0   8581430  0       其他  IT   01305 153915691   教行业   教育  0
2.demo
上面数据的类型如下,可以看到有object,这个类型下放置的特征可以是类别特征,比如数据中的“设计”。
0      int64
1      int64
2     object
3     object
4     object
5      int64
6      int64
7     object
8     object
9     object
10     int64
dtype: object
一个非常奇怪的现象,如果我直接用panda的 read_table读取训练数据,得到的数据类型同上,但是训练模型时,报错如下,说是类型错误,也没有查到到底是啥错误,如何解决。
catboost TypeError: Cannot convert 'b'\xe8\x81\x8c\xe8\xa8\x80\xe8\xb4\x9f\xe8\xb4\xa3\xe4\xba\xba'' to float于是,这里我做了另外一个文本 打开方式,并对响应特征做对应的处理,逻辑如下:
from catboost import CatBoostClassifier, Pool
import pandas as pd
#
dx = [] # 训练数据
dy = [] # 训练label
# cat_feat表示原始数据的第几列为类别特征,当第n列为类别特征时,写到dx中的数据用str转换格式。
cat_feat = [3, 4, 5, 8, 9, 10]
with open('./data/test', 'r') as rf:
    for line in rf:
        line_split = line.strip().split('\t')
        dy.append(int(line_split[0]))
        tmp = []
        for i in range(1, len(line_split)):
            if i not in cat_feat:
                tmp.append(int(line_split[i]))
            else:
                tmp.append(line_split[i])
        dx.append(tmp)
print(dx)

# cat_features训练数据中类别特征的index
cat_features = [2, 3, 4,7, 8, 9]
dxdf = pd.DataFrame(dx)
print(dxdf.dtypes)

model = CatBoostClassifier(iterations=20)
#
model.fit(dxdf, dy, cat_features)
predictions = model.predict(dxdf)
print(predictions)
3.特征重要度打印
接着上面的代码,特征重要度打印的 demo如下:
里面有一个feature_name.txt的文件,里面放了一些特征索引,跟序列数据的顺序对应,它的作用用来给特征重要度标注名字。
0 xid
1 au_cid
2 au_po
3 au_j
4 au_f
5 au_u
6 uid
7 p
8 m
9 poi
10 id
如果没有这个索引,打印的特征重要度如下:
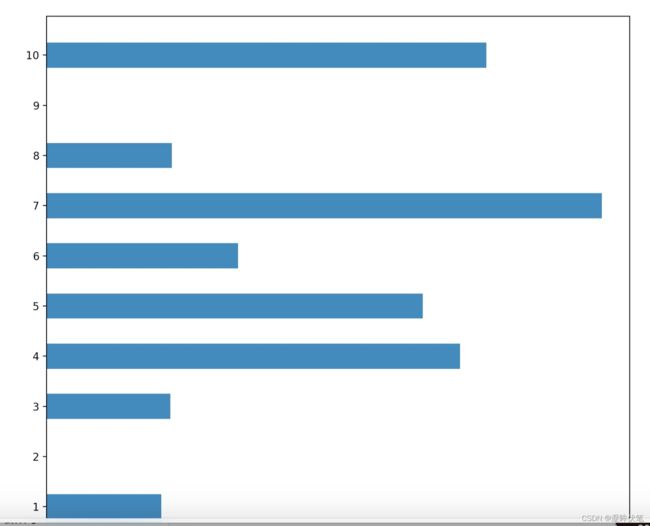
上面的特征重要度图,看起来比较费劲,还是需要让人一眼就看明白什么 特征最重要。这里对上图多了一些优化:
1.将索引改为特征名字
2.将特征重要度从大到小排序
import matplotlib.pyplot as plt
import numpy as np
fea_ = model.feature_importances_
print(fea_)
print(type(fea_))
fea_name = model.feature_names_
print(fea_name)
idx_name = {}
with open('./data/feature_name.txt', 'r') as rf:
    for line in rf:
        ln = line.strip().split(' ')
        idx_name[ln[0]] = ln[1]
print(idx_name)

# fea_arr = np.array(fea_)
idx = np.argsort(fea_)
print('---idx: ', idx)
print(idx.shape)
final_feat = []
final_name = []

for i in idx:
    print('--{0}   {1}'.format(i, fea_[i]))
    final_feat.append(fea_[i])
    final_name.append(idx_name[str(i)])
print(final_feat)
print(final_name)

fig, ax = plt.subplots(figsize=(11, 11))

# Horizontal Bar Plot
ax.barh(final_name, final_feat, height=0.5)

# Remove axes splines
for s in ['top', 'bottom', 'left', 'right']:
    ax.spines[s].set_visible(False)

# Add x, y gridlines
ax.grid(b=True, color='grey',
        linestyle='-.', linewidth=0.5,
        alpha=0.2)
# Add annotation to bars
for i in ax.patches:
    plt.text(i.get_width()+0.2, i.get_y()+0.2,
             str(round((i.get_width()), 2)),
             fontsize=9, fontweight='bold',
             color='black')
ax.set_title('feature importance' )
plt.show()
结果:

4.离线预测
用户维度,选择候选item的topn:
预测的时候,要跟训练特征一致。空缺的做一些填补
from catboost import CatBoostClassifier, Pool
import pandas as pd
from sklearn.model_selection import train_test_split
from sklearn import metrics
from sklearn.model_selection import GridSearchCV
import matplotlib.pyplot as plt
import numpy as np
from collections import Counter
import time, os, sys
from collections import defaultdict

dx = []
dy = []

model = CatBoostClassifier()

model.load_model('pub.model')

topic_path = './predict_data/topic.txt'
user_path = './predict_data/user.txt'
save_path = './cands_xgb.txt'

user_categary = [0, 1, 2, 3, 4, 5, 6]
topic_categary = [0, 1]
topic_float_feat = []  # 12, 13, 14, 15, 16, 17, 18, 19, 20, 21, 22, 23, 24

user_dict = {}
topic_dict = {}
uid = []
tid = []
with open(topic_path, 'r') as tp, open(user_path, 'r') as user:
    for u_line in user:
        line_split = u_line.strip().split('\t')
        user_temp = []
        for i in range(0, len(line_split)):
            if i in user_categary:
                user_temp.append(str(line_split[i]))
        user_dict[line_split[0]] = user_temp
    for t_line in tp:
        line_split = t_line.strip().split('\t')
        topic_temp = []
        for i in range(0, len(line_split)):
            if i in topic_categary:
                topic_temp.append(str(line_split[i]))
            elif i in topic_float_feat:
                topic_temp.append(float(line_split[i]))
            else:
                topic_temp.append(int(line_split[i]))
        topic_dict[line_split[0]] = topic_temp

uid = list(user_dict.keys())
tid = list(topic_dict.keys())


def get_top_n(lists, n):
    sort_index = np.argsort(lists)
    n_index = sort_index[-n:]  # 因为是按照概率从大到小取n个
    indexs = list(reversed(n_index))
    return indexs

with open(save_path, 'w') as wf:
    st = time.time()
    cnt = 0
    for u in uid:
        score_dict = {}
        dx = []
        for t in tid:
            uf = user_dict[u]
            tf = topic_dict[t]
            feat = uf + tf
            dx.append(feat)
        dxdf = pd.DataFrame(dx)
        row, col = dxdf.shape
        if col != 13:
            continue
        preds_proba = model.predict_proba(dx)
        score = preds_proba[:, 1]  # list
        idx = get_top_n(score, 100)
        res = []
        for id in idx:
            res.append(tid[id])
        key = 'xgb_' + str(u)
        val = '|'.join(res[:10])
        wf.writelines([key + '\t' + val + '\n'])
        cnt = cnt + 1
        if cnt % 1000 == 0:
            end = time.time()
            print('---time cost is : ', end -  st)
离线预测的数据形式:
xgb_162 40188|40199|42051|41371|40575|40300|40155|43292|41055|39711
xgb_201 40188|40199|41371|40575|40300|40155|41055|39711|40385|42051
xgb_242 40188|40199|40575|41371|42051|40300|40155|41055|43292|39711
xgb_247 40188|40199|41371|40575|40155|40300|41055|42051|43292|39711
xgb_258 40188|40199|41371|40300|40155|41055|40575|39711|40385|42051
xgb_666 40188|40199|41371|40575|40300|40155|41055|43292|42051|39711
xgb_924 40188|40199|41371|40575|40155|40300|41055|39711|41162|40385
xgb_990 40188|40199|41371|40575|40300|40155|41055|39711|41162|41120
演示完毕。
我的学习笔记,永不付费浏览,这是我的原则之一。今天也听到了浅墨离开的消息,难过,研究生期间,全靠他的blog续命,希望将来的某一天,本土文化游戏如你所愿,也希望净肃某些垃圾企业文化。
此致敬礼