【实验】实验三 MATLAB可视化20211125
本文仅供学习和复习使用。 题目源于岑冠军老师,答案参考自相关课件,另外借以markdown排版成此文。由于本人水平有限且时间不够充裕,故难免有错漏或不当之处,如有建议或批评还请联系[email protected],谢谢!
目录
- 实验三 MATLAB可视化
-
- 一、实验目的
- 二、实验原理
- 三、实验内容
实验三 MATLAB可视化
@Copyright 华南农业大学 数学与信息学院 数学系 主讲与制作:岑冠军
一、实验目的
- 掌握 MATLAB常用的二维和三维绘图函数;
- 掌握MATLAB的图形动画;
- 掌握MATLAB的图形注释;
- 熟悉MATLAB常用的图形修饰。
二、实验原理
- MATLAB二维绘图:plot,fplot,fimplicit;
- MATLAB三维绘图:meshgrid,mesh,surf,fmesh,fsurf,fimplicit3;
- MATLAB动画:animatedline,addpoints,drawnow;
- MATLAB图形注释:xlabel,ylabel,zlabel,title,legend,text,annotation;
- MATLAB三维场景控制及其它:view,material,light,alpha,colormap。
三、实验内容
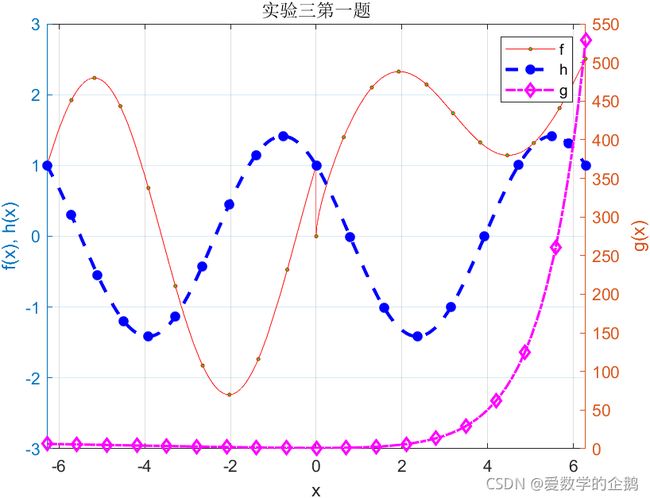
- 函数定义为: { x + sin ( x ) x ≥ 0 2 sin ( x ) + cos ( x ) x < 0 , h ( x ) = cos ( x ) − sin ( x ) , g ( x ) = e x − x \left\{\begin{matrix} \sqrt{x} + \sin(x) & x \geq 0\\ 2 \sin(x) + \cos(x) & x < 0 \end{matrix}\right., h(x) = \cos(x) - \sin(x), g(x) = e^x - x {x+sin(x)2sin(x)+cos(x)x≥0x<0,h(x)=cos(x)−sin(x),g(x)=ex−x,请在同一副图中绘制 f ( x ) , h ( x ) , g ( x ) , − 2 π ≤ x ≤ 2 π f(x), h(x), g(x), -2 \pi \leq x \leq 2 \pi f(x),h(x),g(x),−2π≤x≤2π,要求:
(1) 给出轴标签,图例,图形标题为“实验三第一题”;
(2) f ( x ) f(x) f(x)线条颜色红色,线型为实线,标记形状为o, h ( x ) h(x) h(x)线条颜色蓝色,线型为虚线,标记形状为星号,线宽为2, g ( x ) g(x) g(x)线条颜色品红色,线型为点划线,标记形状为菱形,线宽为1.5;
(3) f ( x ) f(x) f(x)标记大小为2,标记填充颜色为青色,间隔5个点显示一个标记;
(4) 每条曲线都能清晰的显示。
% 创建一个新的画布
figure;

% 初始化函数 f(x) h(x) g(x)
f1 = @(x) ((sqrt(x) + sin(x)).*(x>=0) + (2.*sin(x) + cos(x)).*(x<0));
h1 = @(x) cos(x) - sin(x);
g1 = @(x) exp(x) - x;
domain = [-2*pi 2*pi]; % 定义域

% yyaxis 绘制双y轴图
% hold 添加新图时保留当前绘图
% 关于 yyaxis 请参考 https://ww2.mathworks.cn/help/matlab/ref/yyaxis.html
% 关于 hold 请参考 https://ww2.mathworks.cn/help/matlab/ref/hold.html

yyaxis left % 双 y 轴左侧
% fplot() 直接使用函数句柄和定义域绘图
% 具有属性 MarkerSize, MarkerFaceColor, DisplayName, LineWidth
fplot(f1, domain, '-or', "MarkerSize", 2, "MarkerFaceColor", 'g', "DisplayName", "f");
hold on
fplot(h1, domain, '--*b', "LineWidth", 2, "DisplayName", "h");
hold off
ylim([-3 3]); % 限制 y 轴范围
ylabel("f(x), h(x)"); % y 轴标签

yyaxis right % 双 y 轴右侧
fplot(g1, domain, '-.dm', "LineWidth", 1.5, "DisplayName", "g");
hold on
hold off % 此处 hold on/off 可以去掉,但保持完整的结构是个好习惯,便于未来添加新图
ylim([0 550]);
ylabel("g(x)");

xlabel("x") % x 轴标签
title("实验三第一题") % 图标题
legend; % 将 fplot 中 "DisplayName" 的图例展示
grid on % 开启网格
clearvars % 清理变量,释放内存
- Ackley函数是经典的算法测试函数,2维Ackley函数的表达式如下:
f ( x , y ) = − 20 e − 0.2 0.5 ( x 2 + y 2 ) − e 0.5 ( cos ( 2 π x ) + cos ( 2 π y ) ) + 22.71282 f(x, y) = -20 e^{-0.2\sqrt{0.5(x^2+y^2)}} - e^{0.5(\cos(2\pi x) + \cos(2\pi y))} + 22.71282 f(x,y)=−20e−0.20.5(x2+y2)−e0.5(cos(2πx)+cos(2πy))+22.71282要求:
(1) 绘制Ackley函数在 − 5 ≤ x , y ≤ 5 -5 \leq x, y \leq 5 −5≤x,y≤5区域内的三维网格曲面图;
(2) 指定颜色数组为 C = X × Y C = X \times Y C=X×Y,边缘线条为flat,面颜色为interp,光源模式为线性插值。
figure;
% 采用函数绘图的时候,一定要注意 .* 和 ./ 等点运算
f2 = @(x, y) -20 .* exp(-0.2 .* sqrt(0.5.*(x.^2 + y.^2))) - exp(0.5 .* (cos(2.*pi.*x) + cos(2.*pi.*y))) + 22.71282;
x2 = linspace(-5, 5, 100);
y2 = linspace(-5, 5, 100);
[X2, Y2] = meshgrid(x2, y2); % 使用向量构建网格,类似于笛卡尔积的方式
Z2 = real(f2(X2, Y2)); % 为避免出现形如 a+bi(b=0) 的复数使报错,这里采用函数 real()
C2 = X2 .* Y2;

% 关于 mesh() 请参考 https://ww2.mathworks.cn/help/matlab/ref/mesh.html
s2 = mesh(X2, Y2, Z2, C2); % s2 接收一个 mesh 对象
% 下面通过 . 运算符改变此对象的属性,您可通过注释某一行代码以查看效果差别
s2.EdgeColor = 'flat'; % 边缘线条为 'flat'
s2.FaceColor = 'interp'; % 面颜色为 'interp'
s2.FaceLighting = 'gouraud'; % 光源为 'gouraud' (线性插值)
s2.FaceAlpha = 0.8;
colorbar;
clearvars
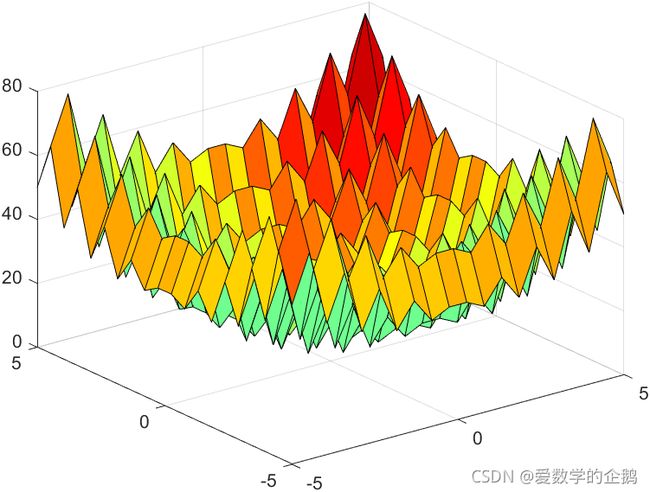
- Rastrigin函数是经典的算法测试函数,2维Rastrigin函数的表达式如下:
f ( x , y ) = 20 + x 2 + y 2 − 10 ( cos ( 2 π x ) + cos ( 2 π y ) ) , f(x, y) = 20 + x^2 + y^2 - 10(\cos(2\pi x) + \cos(2\pi y)), f(x,y)=20+x2+y2−10(cos(2πx)+cos(2πy)),要求:
(1) 绘制Rastrigin函数在 − 5 ≤ x , y ≤ 5 -5 \leq x, y \leq 5 −5≤x,y≤5区域内的三维网格曲面图;
(2) 设置颜色方案为jet;
(3) 调整视角、光源、反射光线呈现一定的效果。
figure;
f3 = @(x, y) 20 + x.^2 + y.^2 - 10.*(cos(2.*pi.*x) + cos(2.*pi.*y));
x3 = linspace(-5, 5, 20);
y3 = linspace(-5, 5, 20);
[X3, Y3] = meshgrid(x3, y3);
Z3 = f3(X3, Y3);

colormap 'jet'; % 设置颜色方案 'jet'

% surf() 绘制曲面图
% surfl() 绘制具有光线照射的曲面图,l 即 light
% 关于 surfl() 请参考 https://ww2.mathworks.cn/help/matlab/ref/surfl.html
s3 = [-45 20]; % 指定光源的方向,使方位角为 45 度,仰角为 20 度
k3 = [.65 .4 .3 10]; % 通过增加环境光贡献度和减少漫反射与镜面反射贡献度来提高曲面的反射值
surfl(X3, Y3, Z3, s3, k3);
clearvars
- 设 x k x_k xk为第 k k k代种群的数量,则在Logistic阻滞增长模型假设下,第 k + 1 k+1 k+1代种群的数量为
x k + 1 = x k + r x k ( 1 − x k K ) , ( k = 0 , 1 , 2 , ⋯ ) , x_{k+1} = x_k + rx_k \left(1 - \frac{x_k}{K}\right), (k = 0, 1, 2, \cdots), xk+1=xk+rxk(1−Kxk),(k=0,1,2,⋯),令 x 0 = 10 x_0 = 10 x0=10, K = 600 K = 600 K=600,繁殖代数为200:
(1)请用subplot将图形分为1行3列的窗格,依次绘制种群增长率 r = 1.9 , 2.1 , 2.9 r = 1.9, 2.1, 2.9 r=1.9,2.1,2.9的种群动态变化曲线;
(2)种群动态变化曲线采用动画线条动态展示;
(3)试描述你观察到的现象。
figure;
set(gcf,'position',[0 0 900 250]); % 设置图片尺寸
f4 = @(x, r) x + r.*x.*(1 - x./600); % 定义种群迭代函数

% !!注意这里的 animatedline 对象是需要创建在指定子图区域之后的
% 关于 subplot() 请参考 https://ww2.mathworks.cn/help/matlab/ref/subplot.html
% 关于 animatedline() 请参考 https://ww2.mathworks.cn/help/matlab/ref/animatedline.html
% 关于 addpoints() 请参考 https://ww2.mathworks.cn/help/matlab/ref/addpoints.html

subplot(1, 3, 1); % 在 figure 中设置 1 行 3 列的子图,这里选择第 1 个区域
x1 = 10; % 初始化种群数量,这里下标 1 表示第 1 个增长率对应的种群数量,而不是代数
r1 = 1.9; % 初始化增长率,这里下标 1 表示第 1 个增长率,即 1.9
an41 = animatedline(0, x1, 'Color', 'r'); % 创建一个 animatedline 对象,并将最初代的信息传入

subplot(1, 3, 2);
x2 = 10;
r2 = 2.1;
an42 = animatedline(0, x2, 'Color', 'g');

subplot(1, 3, 3);
x3 = 10;
r3 = 2.9;
an43 = animatedline(0, x3, 'Color', 'b');

for k = 1:200 % 繁殖代数为 200 代
    x1 = f4(x1, r1); % 更新新一代的数量
    addpoints(an41, k, x1); % addpoints() 为对象 an41 传入新一代的信息:代数为 k,数量为 x1
    drawnow limitrate; % 加速动画演示

    x2 = f4(x2, r2);
    addpoints(an42, k, x2);
    drawnow limitrate;

    x3 = f4(x3, r3);
    addpoints(an43, k, x3);
    drawnow limitrate;
end
clearvars
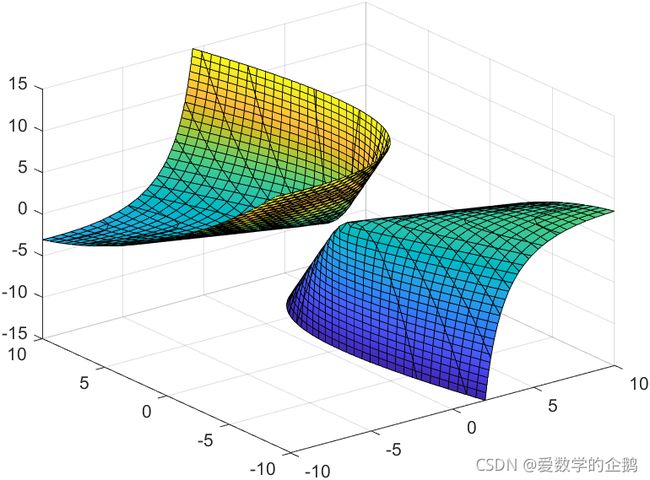
- 绘制单叶双曲抛物面:
x 2 + y 2 + 3 x y + 3 x z − 2 x − 2 y − 2 z + 1 = 0 , − 10 ≤ x , y ≤ 10 , − 15 ≤ z ≤ 15 , x^2 + y^2 + 3xy + 3xz - 2x - 2y - 2z + 1 = 0, -10\leq x, y\leq 10, -15\leq z \leq 15, x2+y2+3xy+3xz−2x−2y−2z+1=0,−10≤x,y≤10,−15≤z≤15,并在抛物面连接的位置加上箭头注释——连接位置。
figure;
f5 = @(x, y, z) x.^2 + y.^2 + 3.*x.*y + 3.*x.*z - 2.*x - 2.*y - 2.*z + 1;

% fimplicit3() 通过函数句柄绘制三维隐函数图像
% 关于 fimplicit3() 请参考 https://ww2.mathworks.cn/help/matlab/ref/fimplicit3.html
interval = [-10 10 -10 10 -15 15]; % 绘图区间
fimplicit3(f5, interval); % 绘制三维隐函数
clearvars


