Lending Club贷款数据转换与融合
1. 数据源
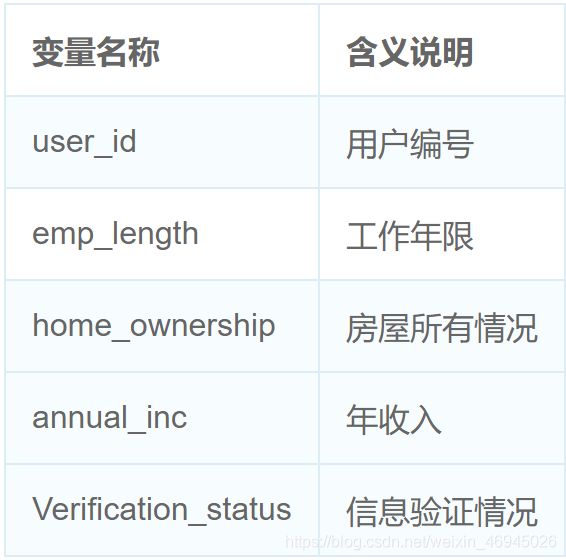
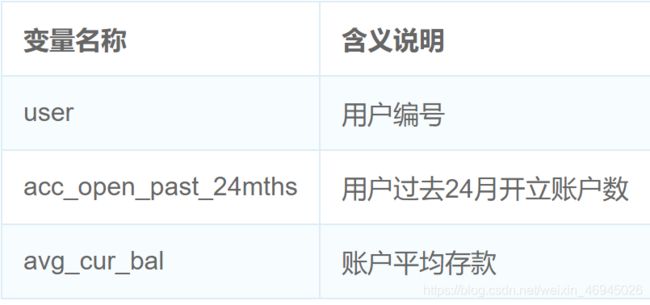
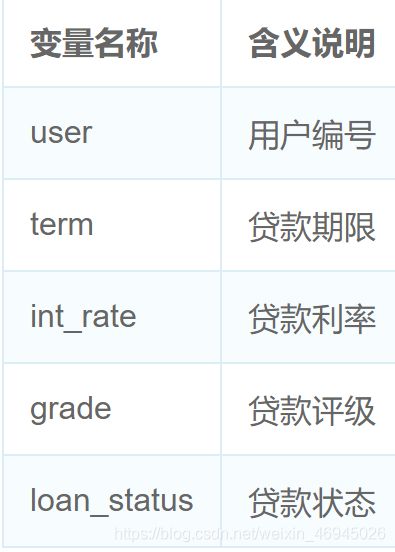
Lending Club是一家美国P2P公司,投资者在平台中为融资方提供资金,并以此获得贷款利率收益。Lending Club为投资者与融资方提供平台。本案例中,我们使用Lending Club2015年公开数据集中截取的一小部分进行分析。数据分为三个部分:
(1)用户信息数据
(2)用户历史数据
2. 数据处理及分析
import pandas as pd
import numpy as np
import warnings
warnings.filterwarnings('ignore')
user = pd.read_csv('user.csv')
loan = pd.read_csv('loan.csv')
history = pd.read_csv('history.csv')
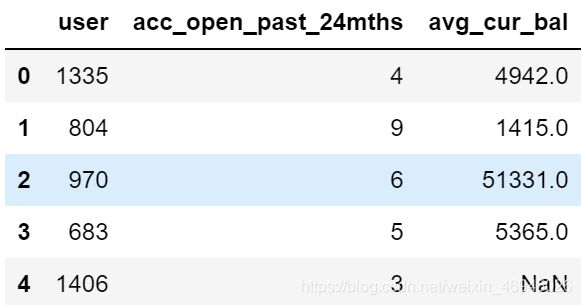
查看用户历史数据前五行。
history.head()
2.1 使用随机采样初步查看数据
我们也可以通过随机采样的方式查看数据的初步情况。我们可以使用sample方法。随机采样的量可以通过参数n或者frac调整,n按指定数量进行采样,frac按指定比例进行采样。
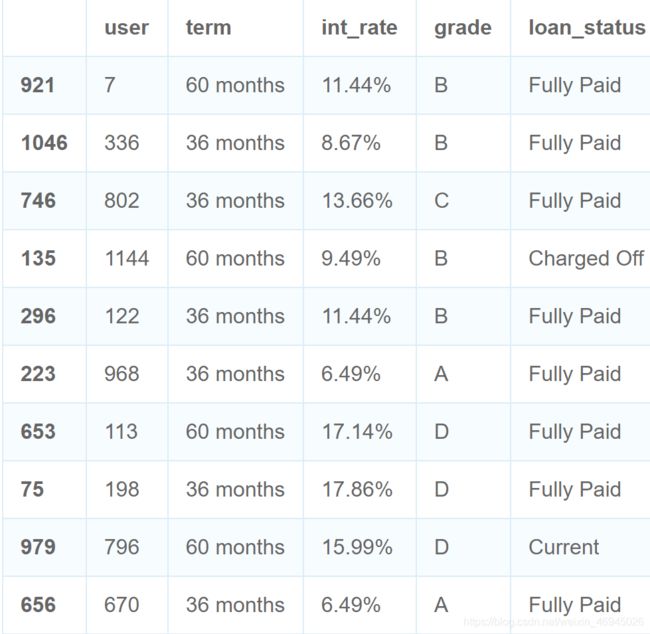
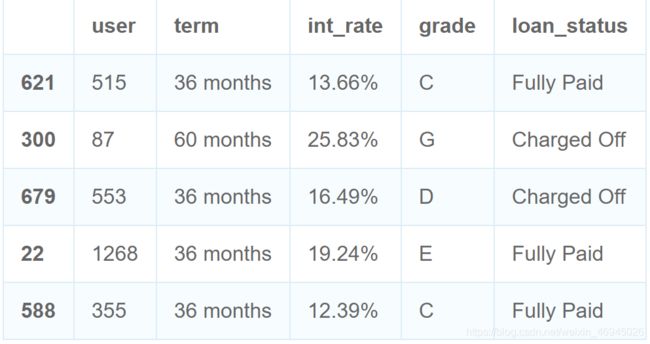
随机查看贷款交易数据中的5行。
随机查看贷款交易数据中的1%。
loan.sample(frac=0.01)
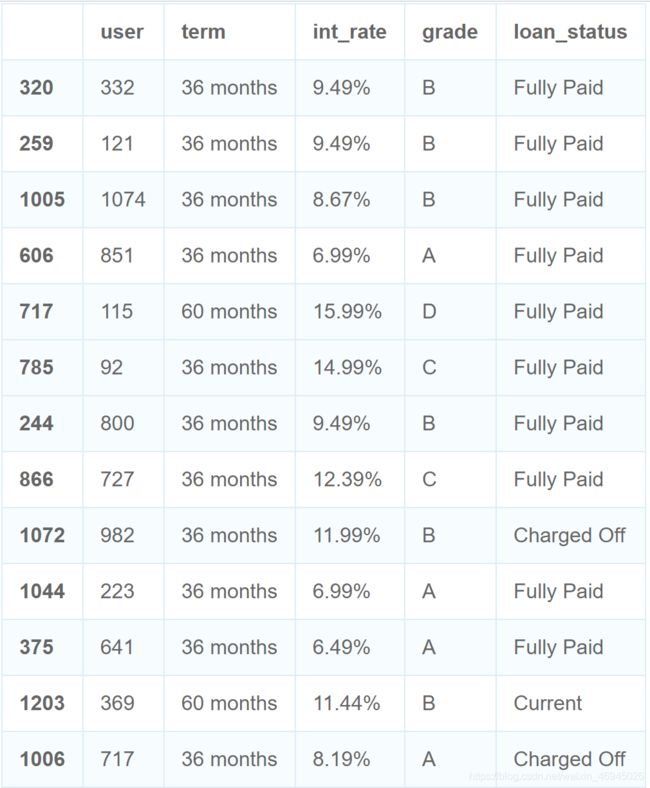
sample默认的是不放回采样(每个样本只可能出现一次),我们也可以调整replace参数为True改为有放回采样。
loan.sample(n=10,replace=True)
有时,我们希望重复调用某次采样的结果,我们可以设定random_state参数为同一个数来实现。
loan.sample(n=5,random_state=1)
loan.sample(n=5,random_state=1)
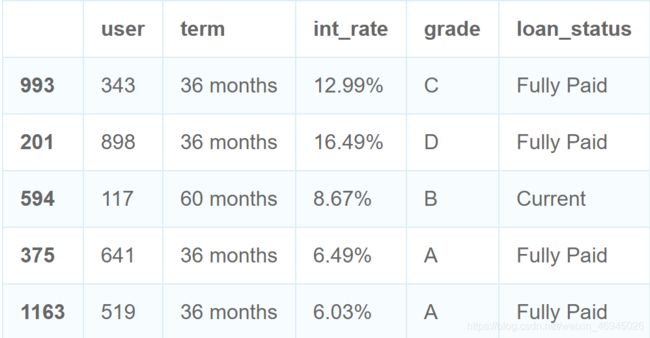
两次采样的结果完全一致。这里random_state的数值大小没有实际意义,只是用来指定某一次的随机数生成结果,可以取任意的自然数。
除了行采样,sample也可以实现列采样,只需要调整axis参数为1即可。
loan.sample(n=3,axis=1)
2.2 使用merge与join进行数据融合
可以看到,三个数据集都有共同的变量:用户编号(但在不同的数据表中命名略有不同),我们可以基于这一公共变量对数据进行合并。
这里我们先提取出一部分数据详细介绍merge与join的联系与区别。
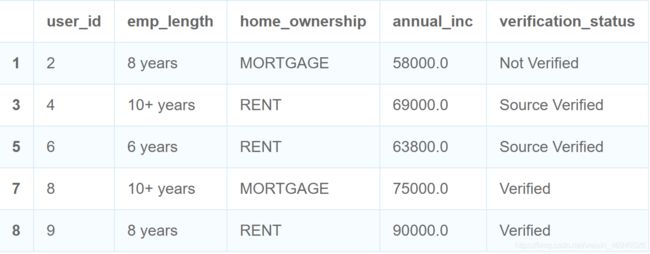
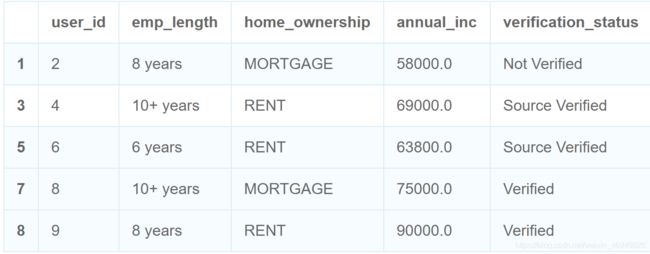
test_user = user.loc[[1,3,5,7,8]]
test_user
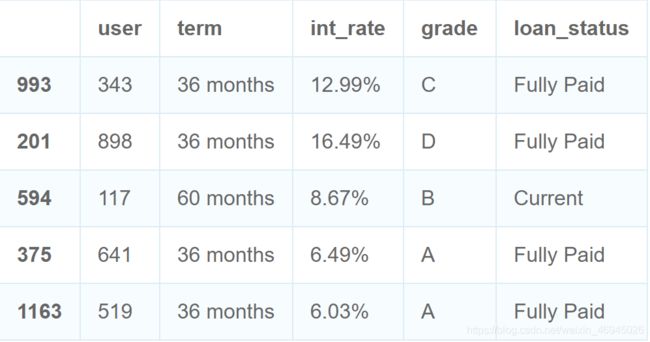
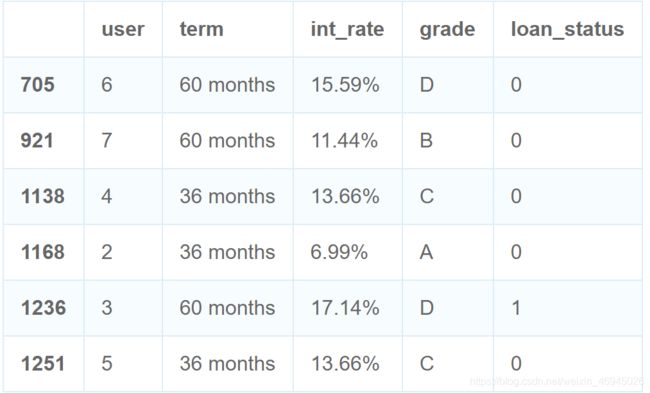
test_loan = loan[loan.user.isin([2,3,4,5,6,7])]
test_loan
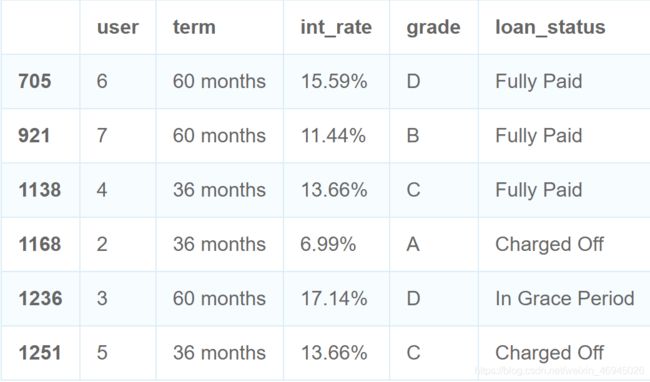
merge和join作为Pandas中常用的数据融合方法,目的都是将两个数据表通过共同变量进行连接。我们先来看一看merge的各个参数:
left.merge(right, how=‘inner’, on=None, left_on=None, right_on=None, left_index=False, right_index=False, sort=False, suffixes=(’_x’, ‘_y’), indicator=False)
left和right分别指代我们要进行连接的两个数据框。
on, left_on, right_on, 用来指定连接的变量。若这一变量在两个数据框中命名相同,直接使用on指定即可,否则通过left_on和right_on分别指定左表变量名和右表变量名。
若需要基于数据框的索引进行连接,则要通过设定left_index和right_index的参数为True来实现。
how为连接方式,有’inner’, ‘left’, ‘right’, 'outer’四种,我们通过几个例子来对比一下。
基于用户信息数据的’user_id’变量和贷款交易数据的’user’变量进行内连接(inner)。这种方式下,只有所选定列在左表与右表能匹配的行会被保留。
test_user.merge(test_loan,how="inner",left_on="user_id",right_on="user")
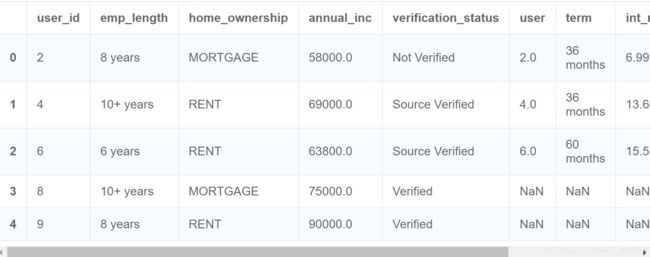
基于用户信息数据的’user_id’变量和贷款交易数据的’user’变量进行左连接(left)。这种方式下,左表所有行都被保留,不能匹配的部分用缺失值填充。
test_user.merge(test_loan,how="left",left_on="user_id",right_on="user")
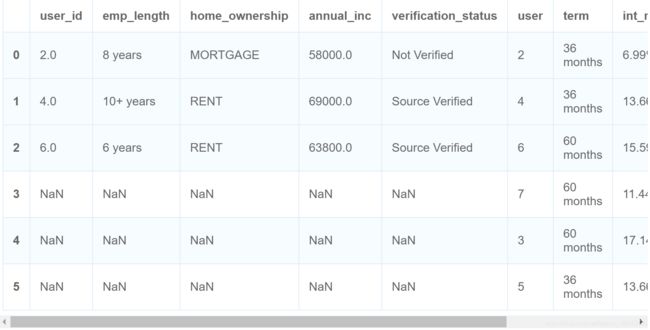
基于用户信息数据的’user_id’变量和贷款交易数据的’user’变量进行右连接(right)。这种方式下,右表所有行都被保留,不能匹配的部分用缺失值填充。
test_user.merge(test_loan,how="right",left_on="user_id",right_on="user")
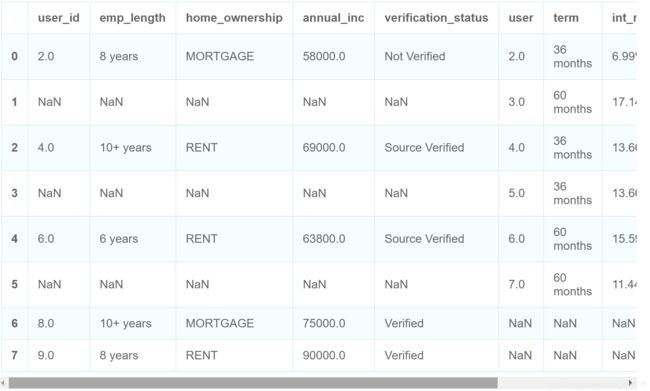
基于用户信息数据的’user_id’变量和贷款交易数据的’user’变量进行外连接(outer)。这种方式下,左表和右表所有行都会被保留,不能匹配的部分用缺失值填充。
test_user.merge(test_loan,how="outer",left_on="user_id",right_on="user")
merge中的indicator参数能很好地帮助我们找到返回结果的来源:
test_user.merge(test_loan,how="outer",left_on="user_id",right_on="user",indicator=True)
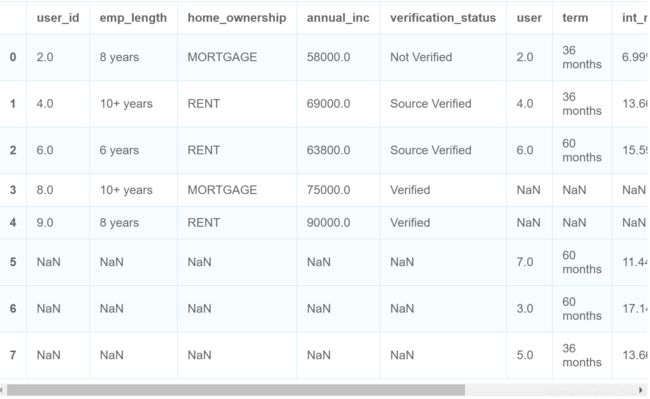
设定indicator参数为Ture后,返回结果中多了一列"_merge",取值有"both", “left_only”, "right_only"三种。分别代表左右表匹配成功,左表有而右表没有,右表有而左表没有三种情况。
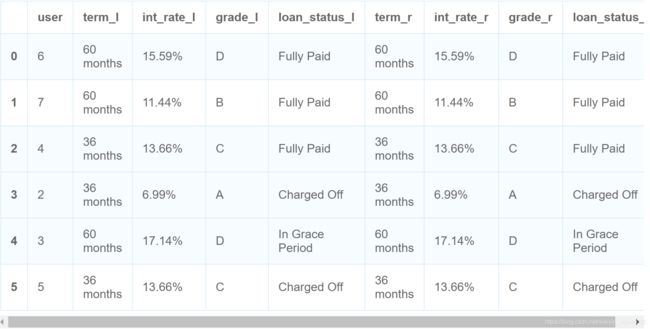
当左表与右表中变量同名时,我们可以通过suffixes参数为左表变量与右表变量附加不同字段,便于后续区分。
test_loan.merge(test_loan,on='user',suffixes=('_l','_r'))
我们再来看一下join的各个参数:
left.join(right, on=None, how=‘left’, lsuffix=’’, rsuffix=’’, sort=False)
join的参数比merge要简单很多,且各参数merge中含义基本一致,这里不再赘述。事实上,join就是merge的简化版本,所有join能实现的操作,我们都可以使用merge实现,但一些情况下,使用join可以使我们的代码更简洁。(后文我们将结合get_dummies使用)。但需要注意:
使用join时,右表只能基于索引进行连接;
通过on参数,可以指定左表进行连接的变量(可以是索引也可以是任意列)。
merge和join中还有一个参数sort,指定为True会让返回的结果按连接变量进行升序排列。
test_user.merge(test_loan,how="outer",left_on="user_id",right_on="user", sort=True)
2.3 使用sort_index与sort_values进行排序
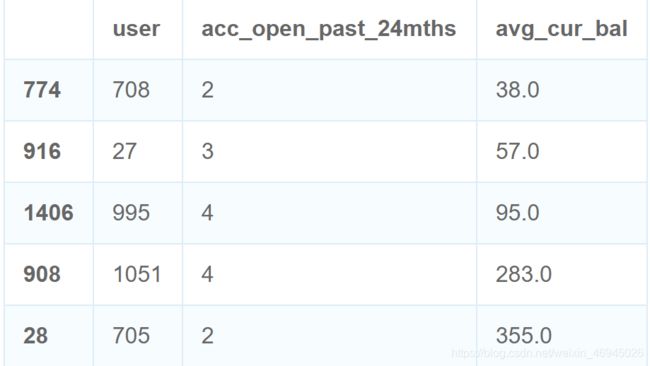
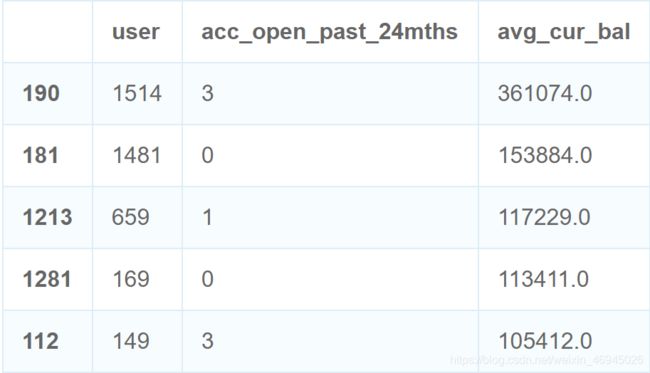
Pandas中的sort_index和sort_values也可以对DataFrame进行排序,sort_index是按照索引进行排序,sort_values是按照指定变量排序。例如我们想将用户历史数据按账户平均存款排序。
history.sort_values(by='avg_cur_bal')[:5]
history.sort_values(by='avg_cur_bal',ascending=False)[:5]
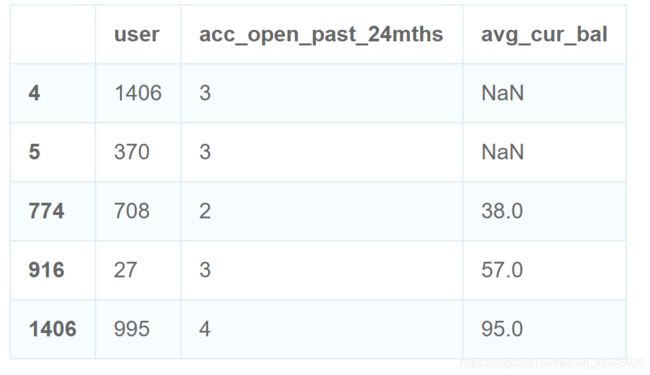
也可以指定对缺失值的排序方式,默认缺失值将排在最后,我们可以设定na_position为first将缺失值排在最前面。
history.sort_values(by='avg_cur_bal',na_position='first')[:5]
下面我们对三个表进行连接,由于我们的最终目的是对每个贷款的最终违约情况进行分析,所以我们基于表"loan"进行两次左连接:
combine = loan.merge(user,how="left",left_on="user",right_on="user_id")
combine = combine.merge(history,how="left",on="user")
combine.head()
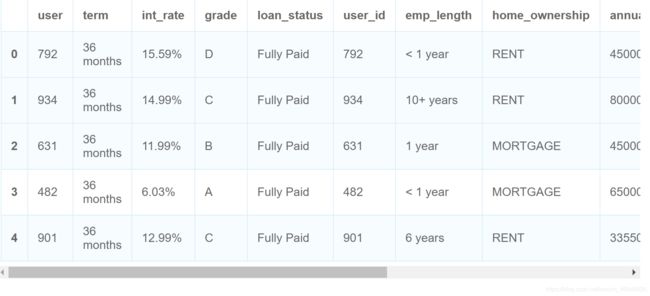
删去用于合并的列名user_id,使用info查看数据缺失情况。
combine.drop(columns="user_id",inplace=True)
combine.info()
Int64Index: 1269 entries, 0 to 1268
Data columns (total 11 columns):
user 1269 non-null int64
term 1269 non-null object
int_rate 1269 non-null object
grade 1269 non-null object
loan_status 1269 non-null object
emp_length 1217 non-null object
home_ownership 1269 non-null object
annual_inc 1269 non-null float64
verification_status 1269 non-null object
acc_open_past_24mths 1269 non-null int64
avg_cur_bal 1268 non-null float64
dtypes: float64(2), int64(2), object(7)
memory usage: 119.0+ KB
emp_length工作年限和avr_cur_bal账户平均存款中存在缺失值,我们将这部分缺失数据删去。
combine.dropna(axis=0,how="any",inplace=True)
combine.info()
Int64Index: 1216 entries, 0 to 1268
Data columns (total 11 columns):
user 1216 non-null int64
term 1216 non-null object
int_rate 1216 non-null object
grade 1216 non-null object
loan_status 1216 non-null object
emp_length 1216 non-null object
home_ownership 1216 non-null object
annual_inc 1216 non-null float64
verification_status 1216 non-null object
acc_open_past_24mths 1216 non-null int64
avg_cur_bal 1216 non-null float64
dtypes: float64(2), int64(2), object(7)
memory usage: 114.0+ KB
我们得到了1216条完整的贷款数据,注意到int_rate利率是object类型,需要对其进行转换。我们使用str.strip方法,str.strip方法是向量化的字符串处理方法,会对Series的每一个元素应用strip。输入参数’%’,将会移除字符串中的’%’。
int_rate = combine.int_rate.str.strip('%')
int_rate[:3]
0 15.59
1 14.99
2 11.99
Name: int_rate, dtype: object
去除’%'后,我们就可以直接使用to_numeric将字符串转化为数值型。
int_rate = pd.to_numeric(int_rate)
int_rate.dtype
dtype(‘float64’)
combine.int_rate = int_rate
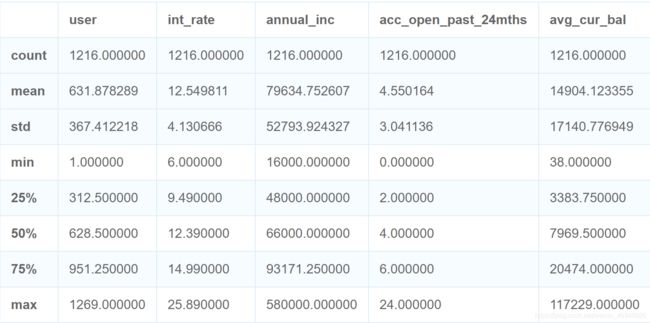
下面使用describe初步查看数据的基本情况。
combine.describe()
2.4 使用cut与qcut将收入变量离散化
数据中,年收入大部分都在100,000元以下,存在高收入异常值,针对这一情况,我们可以尝试将年收入这一连续变量离散化,分割为分类变量。我们使用cut函数按照指定的分割点对数据进行划分。
annual_inc = pd.cut(combine.annual_inc,bins=[np.min(combine.annual_inc)-1,np.percentile(combine.annual_inc,50),np.max(combine.annual_inc)+1],labels=['low','high'])
annual_inc[:3]
0 low
1 high
2 low
Name: annual_inc, dtype: category
Categories (2, object): [low < high]
annual_inc.value_counts()
low 613
high 603
Name: annual_inc, dtype: int64
这里我们通过设定bin参数设定了分割点,将数据按照中位数进行了划分。同时设定了参数labels,使用这个参数可以方便地为新的划分区间命名。
cut也可以直接指定划分份数,将数据等距划分。例如,我们想将数据等距分为五份:
pd.cut(combine.annual_inc,5).value_counts()
(15436.0, 128800.0] 1085
(128800.0, 241600.0] 106
(241600.0, 354400.0] 20
(354400.0, 467200.0] 3
(467200.0, 580000.0] 2
Name: annual_inc, dtype: int64
理论上,数据应被等距分为了五份,每一个区间的长度都相同,但我们计算可以发现,第一个区间的长度为113364,而其他几个区间的长度都为112800。这并不是cut分割错误,只是为了包含最小值或最大值,cut的左右端会拓展0.1%。
Pandas中与cut相似的另一个函数是qcut,它将按照每个区间中频数相同的原则进行划分,当我们指定划分份数后,就会用相应的分位数进行划分。例如,当我们使用qcut将数据分为两份时,分割点就是中位数,四份时分割点就是四分位数。
pd.qcut(combine.annual_inc,2).value_counts()
(15999.999, 66000.0] 613
(66000.0, 580000.0] 603
Name: annual_inc, dtype: int64
combine.annual_inc = annual_inc
这与我们直接使用cut并设定分割点的方式得到的结果一致,但qcut更为简洁。
2.5 使用replace与map对变量进行值替换
下面我们查看贷款的履约情况
combine.loan_status.value_counts()
Fully Paid 942
Charged Off 163
Current 104
Late (31-120 days) 4
In Grace Period 3
Name: loan_status, dtype: int64
我们认为状态为"Charged Off",“In Grace Period”, "Late (31-120 days)"的贷款有违约风险,视为不良贷款,将其值标记为1,其他贷款标记为0。我们使用replace进行值替换。
combine['loan_status'].replace(to_replace=['Fully Paid','Current','Charged Off','In Grace Period','Late (31-120 days)'],
                               value=[0,0,1,1,1],
                               inplace=True)
combine['loan_status'][:8]
0 0
1 0
2 0
3 0
4 0
5 0
6 1
7 1
Name: loan_status, dtype: int64
这里,to_replace指需要替换的值,value指要替换成的新值。replace作为数值替换的方法,适用范围非常之广,可以实现多种操作。我们使用之前的test_loan数据表进行介绍。
test_loan
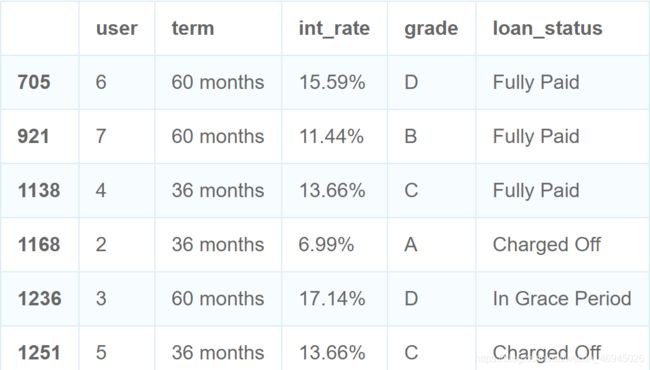
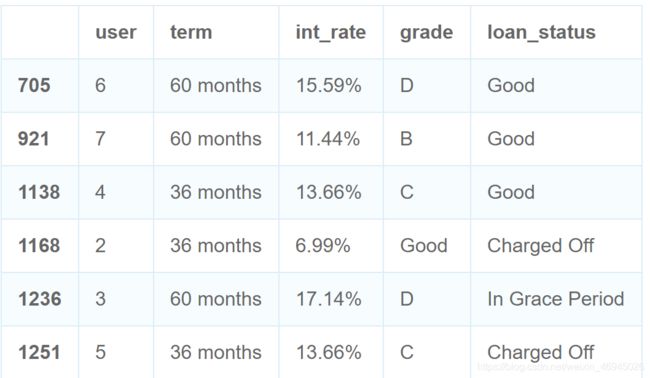
除了像之前那样将需要替换的值与替换的新值分别用列表输入外,我们也可以使用字典进行指定。
test_loan.replace(to_replace={'loan_status':{'Fully Paid':0,'Charged Off':0,'In Grace Period':1}}
test_loan.replace(to_replace={'loan_status':'Fully Paid','grade':'A'},value='Good')
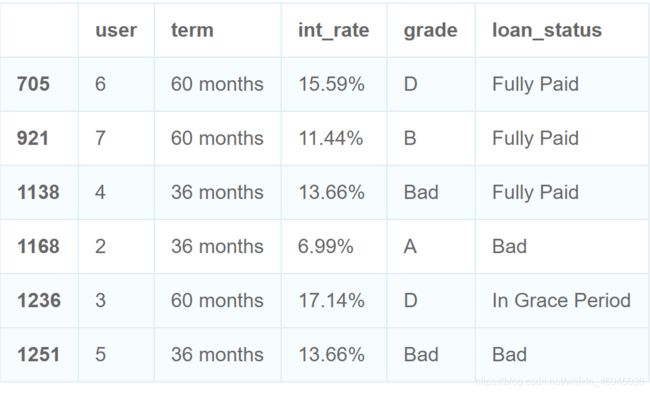
也可以指定正则表达式进行替换,这时需要设定参数regex为True,代表to_replace部分输入的是正则表达式。如查找所有以C开头的字段并替换为Bad。
test_loan.replace(to_replace='C+.*$', value='Bad', regex=True)
在Pandas中,如果只是针对某一个Series进行数值替代,我们也可以使用map方法。
test_loan['loan_status'].map({'Fully Paid':0,'Charged Off':0,'In Grace Period':1})
705 0
921 0
1138 0
1168 0
1236 1
1251 0
Name: loan_status, dtype: int64
这同样实现了将贷款状态进行替换的效果,但map不能像replace一样直接对DataFrame进行操作。不过map不仅仅可以像上面一样输入字典作为参数,也可以直接输入一个函数进行映射。例如,我们想将数据中利率低于12%的映射为’Low’,高于12%的映射为’High’。
combine['int_rate'][:5]
0 15.59
1 14.99
2 11.99
3 6.03
4 12.99
Name: int_rate, dtype: float64
def f(x):
    if x < 12:
        return 'Low'
    else:
        return 'High'
combine['int_rate'][:5].map(f)
0 High
1 High
2 Low
3 Low
4 High
Name: int_rate, dtype: object
这样的自定义函数进行映射是replace方法无法实现的。
2.6 使用get_dummies进行哑变量处理
为了进行建模分析,我们常常还需要对分类变量进行哑变量处理。
cat_vars=['term','grade','emp_length','annual_inc','home_ownership','verification_status']
for var in cat_vars:
    cat_list = pd.get_dummies(combine[var], prefix=var,drop_first=True)
    combine=combine.join(cat_list)
get_dummies函数中我们使用了两个参数。prefix可以为新生成的哑变量添加前缀,这方便我们识别新生成的变量是从原来哪一个变量中得来的。drop_first设置为True将删去所获得哑变量的第一个,这是因为在建模中,有k类的分类变量我们只需要k-1个变量就可以将其描述,如果使用k个变量则会出现完全共线性的问题。
此外,在这里我们选择了使用join而不是merge,这是因为get_dummies返回的结果与原始数据有相同的索引,使用join直接基于索引进行连接更简洁。
pd.get_dummies(combine['grade'], prefix='grade',drop_first=True)[:5]
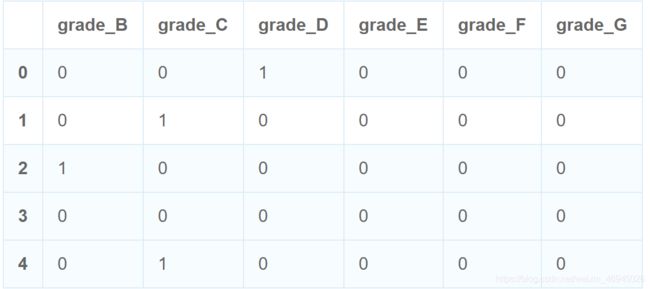
如果我们使用merge将需要这样写:combine=combine.merge(cat_list,left_index=True,right_index=True)
最后,将原始的变量删除,并查看处理后的数据:
combine.drop(columns=cat_vars,inplace=True)
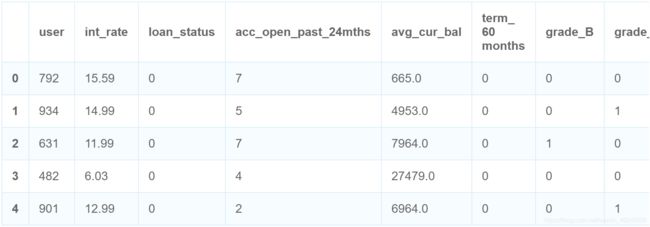
combine.head()
2.7 使用concat添加常数项列
下面,我们提取贷款状态为因变量,其他变量为自变量。
X = combine.drop(columns=['user','loan_status'])
y = combine.loan_status
在回归分析中,我们往往还需要为自变量添加常数项列,值全为1。
首先创建一个长度为X的行数,值全为1的列表。再将其转化为Series,并命名"const"。
const = pd.Series([1] * combine.shape[0],name="const")
使用reset_index重设X的索引,drop会将原来的索引删除。
X.reset_index(drop=True,inplace=True)
使用concat对数据进行合并,并指定方向为列。
X = pd.concat([const,X],axis=1)
X.head()
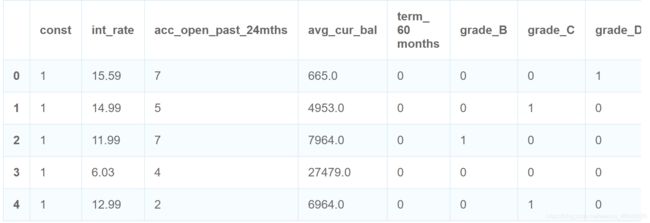
这里之所以要先重新设置X的索引,是因为concat是基于索引进行拼接的。这么看来,对于列的拼接其实直接使用join就可以了,不过目前join只能作为DataFrame的方法,我们想拼接DataFrame和Series就必须把DataFrame写在前面:X.join(const)。
此外,concat更常用的是进行行的连接。我们看一下concat的参数:pandas.concat(objs, axis=0, join=‘outer’)
objs: Series,DataFrame等构成的list
axis: 合并连接的方向,0是行,1是列
join:连接方式,‘inner’或者’outer’
可以看到,concat的对象必须是一个list,因此在实际操作中必须先使用[]将要进行连接的对象转化为list。我们简单生成两个DataFrame进行介绍。
df1 = pd.DataFrame([['a','a', 1], ['b','b', 2]],columns=['letter','letter1','number'])
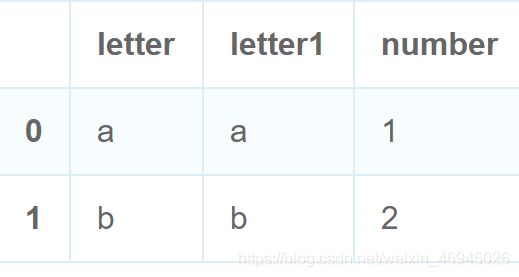
df1
df2 = pd.DataFrame([['c','c', 3], ['d','d', 4]],columns=['letter','letter2', 'number'])
df2
pd.concat([df1,df2],axis=0,join='inner')
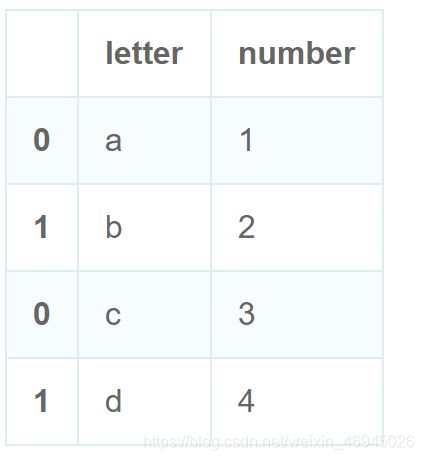
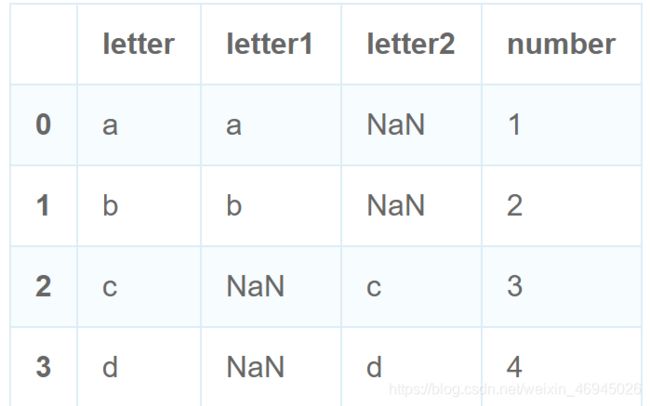
使用outer方式进行连接,所有变量都会保留,不能匹配的部分用缺失值填充。
pd.concat([df1,df2],axis=0,join='outer')
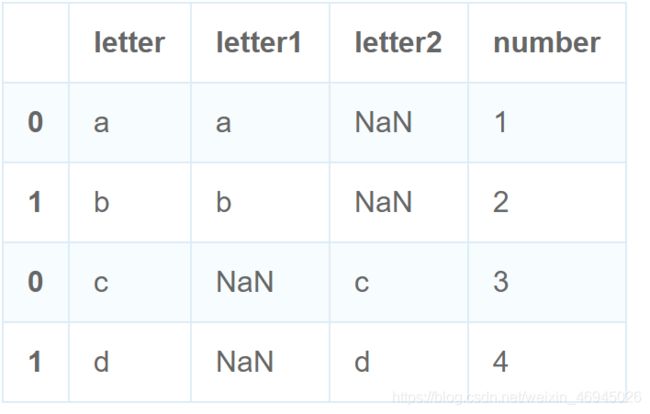
ignore_index参数为Ture将忽略原来的索引,从0开始重建索引。
pd.concat([df1,df2],ignore_index=True)
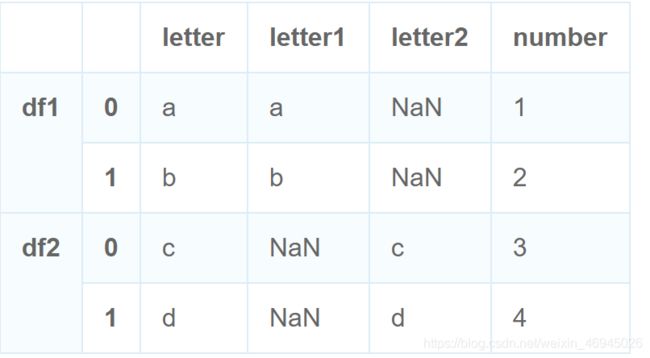
通过key参数可以建立多层索引,方便识别数据来自于哪个数据源。
pd.concat([df1,df2],keys=['df1', 'df2'])
经过以上的处理,我们将三份数据进行了融合,并进行了相应的数据转换,最终得到了因变量y和自变量X,这是后续建模分析的基础。
