sklearn.neighbors 最近邻相关算法,最近邻分类和回归
文章目录
- sklearn.neighbors 最近邻相关算法,分类和插值
-
- 1. 查找最近邻元素
- 2. 最近邻分类
- 3. 最近邻回归
- 4. NearestCentroid 最近邻质心分类
- 5. Neighborhood Components Analysis 邻域成分分析
sklearn.neighbors 最近邻相关算法,分类和插值
主要介绍 sklearn.neighbors 相关方法
1. 查找最近邻元素
from sklearn.neighbors import NearestNeighbors
import numpy as np

'''
找到K近邻
X是训练集,NearestNeighbors 拟合
Y是输入,输出与Y最近的训练集中的样本和距离
'''

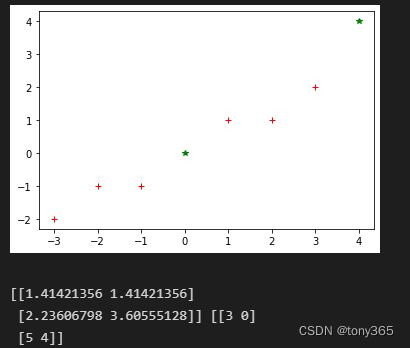
# x 是离散的一些二维点
X = np.array([[-1, -1], [-2, -1], [-3, -2], [1, 1], [2, 1], [3, 2]])
# 最近邻模型,n_neighbors=2 表示2个最近邻,algorithm可以选择使用的算法,结果是一致的,效率高低不同, metric 选择度量方法
nbrs = NearestNeighbors(n_neighbors=2, algorithm='ball_tree', metric='euclidean').fit(X) # ['auto', 'ball_tree', 'kd_tree', 'brute']


Y = np.array([[0, 0], [4, 4]])
plt.figure()
plt.plot(X[..., 0], X[..., 1], 'r+', Y[..., 0], Y[..., 1], 'g*',)
plt.show()

# 查找 Y的2个最近邻的距离  和  索引
distances, indices = nbrs.kneighbors(Y)
print(distances, indices)
输出距离Y最近的2个元素索引和距离
输出邻接矩阵 和 可选的度量方法
# 输出邻接矩阵,稀疏图
nbrs.kneighbors_graph(Y).toarray()
# 输出可以使用的距离指标
from sklearn.neighbors import KDTree, BallTree
print(sorted(KDTree.valid_metrics))
print(sorted(BallTree.valid_metrics))
output:
2. 最近邻分类
最近邻分类,并不进行建模。
scikit-learn 实现了两种不同的最近邻分类器:
KNeighborsClassifier实现基于 查询点的k个最近邻居,其中k是由用户指定的整数值。
RadiusNeighborsClassifier根据固定半径内的邻居数量确定分类,其中r是由用户指定的浮点值。
k-neighbors 分类KNeighborsClassifier 是最常用的技术。k值的最优选择 高度依赖于数据:一般来说,一个更大的k 抑制噪声的影响,但使分类边界不那么明显。
在数据未均匀采样的情况下,基于半径的邻居分类RadiusNeighborsClassifier可能是更好的选择。用户指定固定半径r,使得稀疏邻域中的点使用较少的最近邻进行分类。
对于高维参数空间,由于所谓的“维数灾难”,这种方法变得不太有效。
基本的最近邻分类使用统一权重:也就是说,分配给查询点的值是根据最近邻的简单多数票计算得出的。在某些情况下,最好对邻居进行加权,使得更近的邻居对拟合的贡献更大。
这可以通过weights关键字来完成。默认值 为每个邻居分配统一的权重。 可以提供用户定义的距离函数来计算权重。weights = ‘uniform’ 或者 weights = ‘distance’
使用方法:
n_neighbors = 15
weights = 'distance'
clf = neighbors.KNeighborsClassifier(n_neighbors, weights=weights)
clf.fit(X, y)
clf.predict(input)
3. 最近邻回归
同理,也有最近邻回归
scikit-learn 实现了两个不同的邻居回归器:
KNeighborsRegressor实现基于 查询点的k个最近邻居,其中k是由用户指定的整数值。
RadiusNeighborsRegressor基于固定半径内的邻居实现学习查询点,其中r是由用户指定的浮点值。
使用方法:
n_neighbors = 5
weights = 'uniform'
knn = neighbors.KNeighborsRegressor(n_neighbors, weights=weights)
y_ = knn.fit(X, y).predict(input)
4. NearestCentroid 最近邻质心分类
NearestCentroid
如果我们不再是求解到所有样本的距离,而是求解到不同类别样本中心的距离,距离哪个样本中心最近,我们即认为该待预测样本属于哪个类,这就是NearestCentroid算法.
该算法能降低计算量,但是对于不是中心分布的样本来说,准确率不高。
from sklearn.neighbors import NearestCentroid
import numpy as np
X = np.array([[-1, -1], [-2, -1], [-3, -2], [1, 1], [2, 1], [3, 2]])
y = np.array([1, 1, 1, 2, 2, 2])
clf = NearestCentroid()
clf.fit(X, y)

print(clf.predict([[-0.8, -1]]))
shrink_threshold 参数
粗略理解是 类别中心的特征值 除以 类内方差, 再减去 shrink_threshold 参数,如果大于0,说明该特征方差较大,将被去除,避免影响分类结果。
目的在于去除noisy features,使用后效果有优化
如果有误,还请指正
shrinkage = 0.2
clf = NearestCentroid(shrink_threshold=shrinkage)
clf.fit(X, y)
y_pred = clf.predict(X)
5. Neighborhood Components Analysis 邻域成分分析
这篇博客解释的比较清楚
Neighborhood Components Analysis 是将数据映射到另一个空间,(也可以理解为改变度量距离的函数)
在矩阵A的转换下,计算softmax 概率, 然后把同一类的概率加起来,希望这个概率大。
目标是希望正确分类的概率最大
目标函数为
目前使用 scipy 的 L-BFGS-B 进行Q的求解。 通过设置Q 的维度,可以达到降维的目的。
先使用 Neighborhood Components Analysis 进行转换,再应用KNeighborsClassifier 效果会更好, 因为Neighborhood Components Analysis 将样本转换到一个更好的表达空间。
如果用NCA降维,和LDA,PCA效果比较
NCA分数最高
代码如下:
# License: BSD 3 clause

import numpy as np
import matplotlib.pyplot as plt
from sklearn import datasets
from sklearn.model_selection import train_test_split
from sklearn.decomposition import PCA
from sklearn.discriminant_analysis import LinearDiscriminantAnalysis
from sklearn.neighbors import KNeighborsClassifier, NeighborhoodComponentsAnalysis
from sklearn.pipeline import make_pipeline
from sklearn.preprocessing import StandardScaler

n_neighbors = 3
random_state = 0

# Load Digits dataset
X, y = datasets.load_digits(return_X_y=True)

# Split into train/test
X_train, X_test, y_train, y_test = train_test_split(
    X, y, test_size=0.5, stratify=y, random_state=random_state
)

dim = len(X[0])
n_classes = len(np.unique(y))

# Reduce dimension to 2 with PCA
pca = make_pipeline(StandardScaler(), PCA(n_components=2, random_state=random_state))

# Reduce dimension to 2 with LinearDiscriminantAnalysis
lda = make_pipeline(StandardScaler(), LinearDiscriminantAnalysis(n_components=2))

# Reduce dimension to 2 with NeighborhoodComponentAnalysis
nca = make_pipeline(
    StandardScaler(),
    NeighborhoodComponentsAnalysis(n_components=2, random_state=random_state),
)

# Use a nearest neighbor classifier to evaluate the methods
knn = KNeighborsClassifier(n_neighbors=n_neighbors)

# Make a list of the methods to be compared
dim_reduction_methods = [("PCA", pca), ("LDA", lda), ("NCA", nca)]

# plt.figure()
for i, (name, model) in enumerate(dim_reduction_methods):
    plt.figure()
    # plt.subplot(1, 3, i + 1, aspect=1)

    # Fit the method's model
    model.fit(X_train, y_train)

    # Fit a nearest neighbor classifier on the embedded training set
    knn.fit(model.transform(X_train), y_train)

    # Compute the nearest neighbor accuracy on the embedded test set
    acc_knn = knn.score(model.transform(X_test), y_test)

    # Embed the data set in 2 dimensions using the fitted model
    X_embedded = model.transform(X)

    # Plot the projected points and show the evaluation score
    plt.scatter(X_embedded[:, 0], X_embedded[:, 1], c=y, s=30, cmap="Set1")
    plt.title(
        "{}, KNN (k={})\nTest accuracy = {:.2f}".format(name, n_neighbors, acc_knn)
    )
plt.show()
[1]https://scikit-learn.org/stable/modules/neighbors.html


