基于Matlab的双目视觉三维重建技术
首先需要用到双目视觉平行系统原理

之后了解到三维重建原理


由两张图象的二维图像哥哥像素点的坐标,推导出咱们三维试图重德三维坐标系统中对应的xyz的坐标数值,并显示在Matlab三维图中。
那么像素点怎么找的呢,具体能找到多少个像素点呢,,鉴于现在自己本科那些薄弱的学识,用到的方法就是基元匹配,

使用MATLAB软件进行程序的编写与仿真,对左右摄像头采集到的图像进行特征点的匹配,构建图像的三维模型
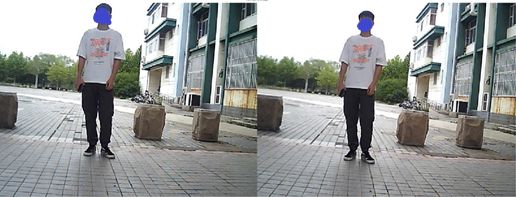
首先拍摄了一组人物图像,下面是原始图像
得到校正后的图像和上边的差不多,就不展示了
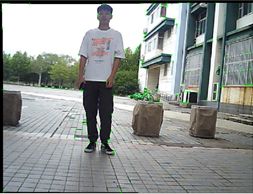
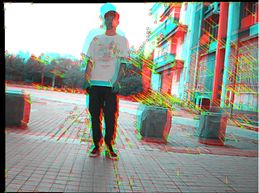
对校正后的图像进行特征点的匹配,发现噪声过大,标注了150个明显特征点

去除掉多余背景特征点之后,得到较为清晰的三维图像
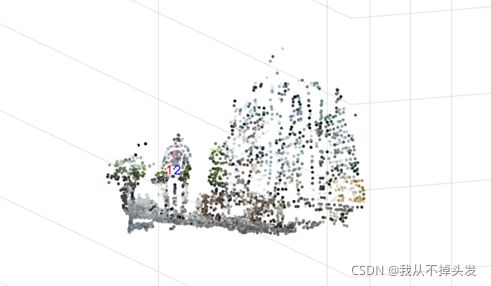
可以看出,这个人物所占的三维空间是很清楚的被展示出来的。
Matlab代码
%%
% 双目立体视觉
% 对比实验

%%
% 清空工作区
clc;
clear;
close all;

%%
% 导入图像数据
I1 = imread('viewleft.png');
I2 = imread('viewright.png');
figure
imshowpair(I1, I2, 'montage');
title('Original Images');
% 导入相机参数
load cameraParams.mat

%%
% 校正
I1 = undistortImage(I1, cameraParams);
I2 = undistortImage(I2, cameraParams);
figure
imshowpair(I1, I2, 'montage');
title('Undistorted Images');

%%
% 特征点提取
imagePoints1 = detectMinEigenFeatures(rgb2gray(I1), 'MinQuality', 0.1);

%%
% 可视化
figure
imshow(I1, 'InitialMagnification', 50);
title('150 Strongest Corners from the First Image');
hold on
plot(selectStrongest(imagePoints1, 150));

%%
% Create the point tracker
tracker = vision.PointTracker('MaxBidirectionalError', 1, 'NumPyramidLevels', 5);
imagePoints1 = imagePoints1.Location;
initialize(tracker, imagePoints1, I1);
% Track the points
[imagePoints2, validIdx] = step(tracker, I2);
matchedPoints1 = imagePoints1(validIdx, :);
matchedPoints2 = imagePoints2(validIdx, :);

%%
% 特征点匹配
figure
showMatchedFeatures(I1, I2, matchedPoints1, matchedPoints2);
title('Tracked Features');

%%
% F矩阵估计
[fMatrix, epipolarInliers] = estimateFundamentalMatrix(...
  matchedPoints1, matchedPoints2, 'Method', 'MSAC', 'NumTrials', 10000);
% 极线
inlierPoints1 = matchedPoints1(epipolarInliers, :);
inlierPoints2 = matchedPoints2(epipolarInliers, :);
% 显示内点
figure
showMatchedFeatures(I1, I2, inlierPoints1, inlierPoints2);
title('Epipolar Inliers');

%%
% R和T(也可以用RANSAC算法)
R = [0.9455,-0.0096,0.3253;
    0.0120,0.9999,-0.0053;
    -0.3252,0.0090,0.9456];
t = [98.4069,0.1741,18.9018];

%%
% 稠密的特征点
imagePoints1 = detectMinEigenFeatures(rgb2gray(I1), 'MinQuality', 0.001);

%%
% Create the point tracker  创建一个跟踪点
tracker = vision.PointTracker('MaxBidirectionalError', 1, 'NumPyramidLevels', 5);
% Initialize the point tracker
imagePoints1 = imagePoints1.Location;
initialize(tracker, imagePoints1, I1);
% Track the points
[imagePoints2, validIdx] = step(tracker, I2);
matchedPoints1 = imagePoints1(validIdx, :);
matchedPoints2 = imagePoints2(validIdx, :);

%%
% cameraMatrix
camMatrix1 = cameraMatrix(cameraParams, eye(3), [0 0 0]);
camMatrix2 = cameraMatrix(cameraParams, R', -t*R');

% 三维点云的计算
points3D = triangulate(matchedPoints1, matchedPoints2, camMatrix1, camMatrix2);

% 获取颜色信息
numPixels = size(I1, 1) * size(I1, 2);
allColors = reshape(I1, [numPixels, 3]);
colorIdx = sub2ind([size(I1, 1), size(I1, 2)], round(matchedPoints1(:,2)), ...
    round(matchedPoints1(:, 1)));
color = allColors(colorIdx, :);

% 创建点云
ptCloud = pointCloud(points3D, 'Color', color);

%%
% 可视化
cameraSize = 0.3;
figure
plotCamera('Size', cameraSize, 'Color', 'r', 'Label', '1', 'Opacity', 0);
hold on
grid on
plotCamera('Location', t, 'Orientation', R, 'Size', cameraSize, ...
    'Color', 'b', 'Label', '2', 'Opacity', 0);

% 点云的可视化
pcshow(ptCloud, 'VerticalAxis', 'y', 'VerticalAxisDir', 'down', ...
    'MarkerSize', 45);

% Rotate and zoom the plot
camorbit(0, -30);
camzoom(1.5);

% Label the axes
xlabel('x-axis');
ylabel('y-axis');
zlabel('z-axis')
title('Up to Scale Reconstruction of the Scene');
哈哈,顺便说一句,需要在文件中建立加上两张左右相机拍摄出的两张视差照片,并且矫正好,输入你们的相机的R T的参数,这样一个标准的三维重建图片就做好了
我这次实验用的是
