如何利用python中的pandas模块计算环比和同比
在利用python进行业务数据分析时,往往需要使用pandas计算环比、同比及增长率等指标,为了能够更加方便的进行的统计数据,整理方法如下。
1.数据准备
为方便进行演示,此处提前生成需要进行统计的数据,数据已经是按照时间维度进行排序。
months = pd.date_range(start='2010-01-01', end='2020-12-31', freq='M')
test_df = pd.DataFrame({'month': months,
                  'v': 100*np.random.rand(months.shape[0], 1).reshape(months.shape[0])})
2.环比计算
2.1 方法1
test_df['v_last']=test_df['v'].shift(1)
test_df['month_erlier_1']=test_df['v']/test_df['v_last']-1
2.2 方法2
test_df['m_m_diff']=test_df['v'].diff()
test_df['month_erlier_2']=test_df['m_m_diff']/test_df['v'].shift(1)
2.3 方法3
test_df['month_erlier_3']=test_df['v'].pct_change()
3.同比计算
继续使用上述构建的数据源进行计算。
3.1 方法1
test_df["last_year_v"]=test_df['v'].shift(12)
test_df['year_erlier_1']=test_df['v']/test_df['last_year_v']-1
3.2 方法2
test_df["year_diff"]=test_df['v'].diff(12)
test_df['year_diff'].fillna(0,inplace=True)
test_df['year_erlier_2']=test_df['year_diff']/(test_df['v']-test_df['year_diff'])
3.3 方法3
test_df['year_erlier_3']=test_df["v"].pct_change(periods=12)
4.关于pct_change()函数
pct_change主要涉及一下参数:
- periods=1,用来设置计算的周期。
- fill_method=‘pad’,如何在计算百分比变化之前处理缺失值(NA)。
- limit=None,设置停止填充条件,即当遇到填充的连续缺失值的数量n时,停止此处填充
- freq=None,从时间序列 API 中使用的增量(例如 ‘M’ 或 BDay())
4.1 使用例子1
#构建数据
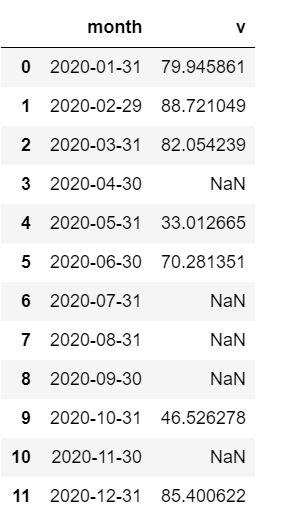
months = pd.date_range(start='2020-01-01', end='2020-12-31', freq='M')
test_df2 = pd.DataFrame({'month': months,
                  'v': 100*np.random.rand(months.shape[0], 1).reshape(months.shape[0])})
test_df2.loc[((test_df2.index>5) & (test_df2.index<9) ),'v']=np.nan
test_df2.loc[test_df2.index==3,'v']=np.nan
test_df2.loc[test_df2.index==10,'v']=np.nan
#向下进行填充,当连续缺失值的数量大于2时不进行填充
test_df2['v'].pct_change(1,fill_method='ffill',limit=2)
4.2 使用例子2
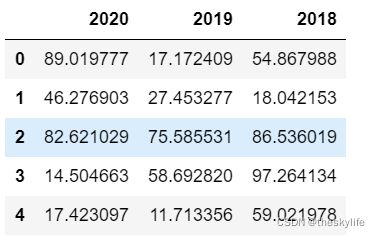
# 生成样本数据
test_df3 = pd.DataFrame({'2020': 100*np.random.rand(5).reshape(5),
                         '2019': 100*np.random.rand(5).reshape(5),
                         '2018':  100*np.random.rand(5).reshape(5)})
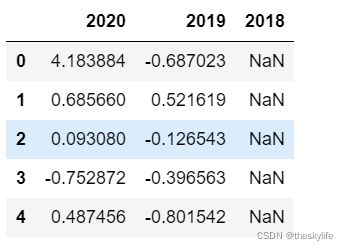
计算同环比:
test_df3.pct_change(axis='columns',periods=-1)
4.3 使用例子3
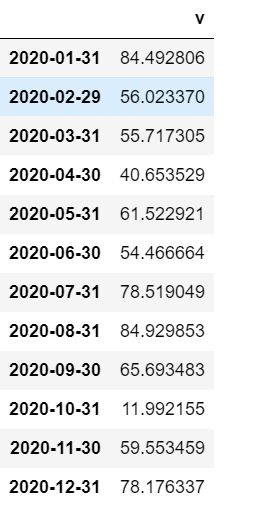
#构建数据样本
months = pd.date_range(start='2020-01-01', end='2020-12-31', freq='M')

test_df4 = pd.DataFrame({
    'v': 100*np.random.rand(months.shape[0], 1).reshape(months.shape[0])}, index=months)
test_df4["v"].pct_change(freq="Q")
计算效果图:
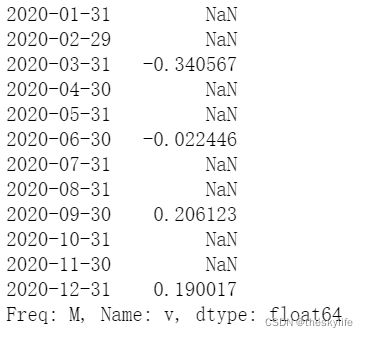
计算过程解释:
2020-03-31行处的值:使用3月份和1月份进行环比,即55.717305/84.492806-1
2020-06-30行处的值:使用6月份和3月份进行环比
5.后记
以上就是时候用pandas进行计算同比和环比的方法,请在使用过程中,结合数据情况先进行数据清洗后,再选择合适的方法进行计算。
