pytorch图片通过LeNet5卷积层所得特征图写入excel
最近想分析一下自己的数据集经过lenet5卷积后所得特征图有什么特点,就写了一个demo将每一张特征图转换成1×n的形式,一个特征写入excel中的一行进行观察总结。
下面附上代码:
import torch
import torch.nn as nn
from collections import OrderedDict

from PIL import Image
import numpy as np
import torchvision.transforms as transforms
import xlwt

class LeNet5(nn.Module):
	"""
	Input - 1x32x32
	C1 - 6@28x28 (5x5 kernel)
	tanh
	S2 - 6@14x14 (2x2 kernel, stride 2) Subsampling
	C3 - 16@10x10 (5x5 kernel, complicated shit)
	tanh
	S4 - 16@5x5 (2x2 kernel, stride 2) Subsampling
	C5 - 120@1x1 (5x5 kernel)
	F6 - 84
	tanh
	F7 - 10 (Output)
	"""
	def __init__(self):
		super(LeNet5, self).__init__()

		self.convnet = nn.Sequential(OrderedDict([
			('c1', nn.Conv2d(1, 6, kernel_size=(5, 5))),
			('relu1', nn.ReLU()),
			('s2', nn.MaxPool2d(kernel_size=(2, 2), stride=2)),
			('c3', nn.Conv2d(6, 16, kernel_size=(5, 5))),
			('relu3', nn.ReLU()),
			('s4', nn.MaxPool2d(kernel_size=(2, 2), stride=2)),
			('c5', nn.Conv2d(16, 120, kernel_size=(5, 5))),
			('relu5', nn.ReLU())
		]))

		self.fc = nn.Sequential(OrderedDict([
			('f6', nn.Linear(120, 84)),
			('relu6', nn.ReLU()),
			('f7', nn.Linear(84, 10)),
			('sig7', nn.LogSoftmax(dim=-1))
		]))

	def forward(self, img):
		output = self.convnet(img)
		#output = output.view(img.size(0), -1)
		#output = self.fc(output)
		return output

if __name__ == '__main__':
	net = LeNet5()
	transform = transforms.Compose([
			transforms.Resize((32, 32))
			])
	m = 0
	file = xlwt.Workbook()
	table = file.add_sheet('feature',cell_overwrite_ok=True)

        #两个for循环读取不同类的图片
	for i in range(1,10):
		for j in range(1,12):
			img = Image.open('/datasets/0' + str(i) + '-' + "{:0>2d}".format(j) + '.png')
			img = transform(img)
			#img = img.convert('L') 灰度图/二值图则无需转
			np.set_printoptions(threshold=np.inf)
			img = np.array(img)/255.0
			img = img.reshape(1,1,32,32)   #需要numpy,不能PIL
			img = torch.from_numpy(img)	   #numpy转换为tensor
			net.load_state_dict(torch.load('/a.pkl'))
			output = net.forward(img.float())
			output_np = output.detach().numpy().reshape(1,120)
			#print(output_np.reshape(1,120).shape)
			for t in range(0,120):
				table.write(m,t,str(output_np[0,t]))
                        #变量m实现excel表格中的换行
			m += 1
	file.save('feature.xls')
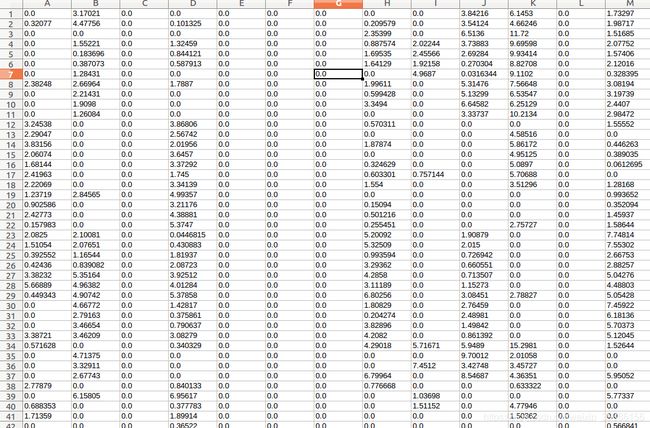
所得结果如图(截取部分数据),每一行是一个特征图中的数值:
