文章目录
- PyTorch示例——LinearModel
-
- 版本信息
- 导包
- 原始数据
- 构建模型
- 开始训练
- 绘制曲线:epoch与loss
- 查看权重、偏置信息
- 利用模型做预测
PyTorch示例——LinearModel
版本信息
- PyTorch:
1.12.1
- Python:
3.7.13
导包
import torch
import matplotlib.pyplot as plt
原始数据
X_data = torch.Tensor([[1.0, 2.9], [2.0, 6.1], [3.0, 9.2], [4.0, 12.3], [5.0, 14.9], [6.0, 18.1]])
y_data = torch.Tensor([[0.4], [1.4], [2.8], [3.5], [4.8], [5.5]])
构建模型
class MyLinearModel(torch.nn.Module):
def __init__(self):
super(MyLinearModel, self).__init__()
self.linear = torch.nn.Linear(in_features=2, out_features=1)
def forward(self, x):
output = self.linear(x)
return output
开始训练
learning_rate = 0.005
epoch_num = 20
my_model = MyLinearModel()
loss = torch.nn.MSELoss()
optimizer = torch.optim.SGD(my_model.parameters(), lr=learning_rate)
loss_list = []
for epoch in range(epoch_num):
y_pred = my_model(X_data)
l = loss(y_pred, y_data)
optimizer.zero_grad()
l.backward()
optimizer.step()
print(f"Train... ===> epoch = {epoch}, loss = {l.item()}")
loss_list.append(l.item())
Train... ===> epoch = 0, loss = 29.548913955688477
Train... ===> epoch = 1, loss = 8.797457695007324
Train... ===> epoch = 2, loss = 2.6332108974456787
Train... ===> epoch = 3, loss = 0.8021142482757568
Train... ===> epoch = 4, loss = 0.2581847608089447
Train... ===> epoch = 5, loss = 0.09661001712083817
Train... ===> epoch = 6, loss = 0.048613857477903366
Train... ===> epoch = 7, loss = 0.034356359392404556
Train... ===> epoch = 8, loss = 0.03012099117040634
Train... ===> epoch = 9, loss = 0.028862761333584785
Train... ===> epoch = 10, loss = 0.02848881296813488
Train... ===> epoch = 11, loss = 0.02837762050330639
Train... ===> epoch = 12, loss = 0.028344422578811646
Train... ===> epoch = 13, loss = 0.028334492817521095
Train... ===> epoch = 14, loss = 0.028331367298960686
Train... ===> epoch = 15, loss = 0.028330326080322266
Train... ===> epoch = 16, loss = 0.02832990325987339
Train... ===> epoch = 17, loss = 0.028329646214842796
Train... ===> epoch = 18, loss = 0.0283293928951025
Train... ===> epoch = 19, loss = 0.028329243883490562
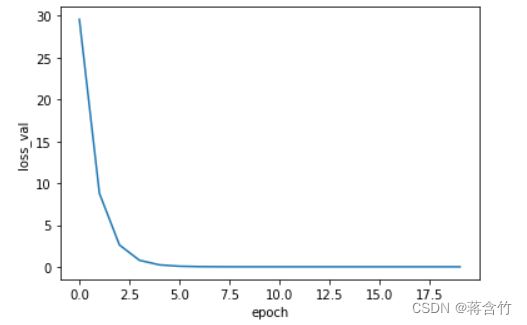
绘制曲线:epoch与loss
plt.plot(epochs, loss_list)
plt.xlabel("epoch")
plt.ylabel("loss_val")
plt.show()

查看权重、偏置信息
print(f"w = {my_model.linear.weight}")
print(f"b = {my_model.linear.bias}")
w = Parameter containing:
tensor([[-0.0156,  0.3502]], requires_grad=True)
b = Parameter containing:
tensor([-0.5856], requires_grad=True)
利用模型做预测
X_test = torch.Tensor([[4.0, 12.0]])
y_pred = my_model(X_test)
print(f"y_pred = {y_pred.data}")
y_pred = tensor([[3.5542]])
