常微分方程组解稳定性的分析
文章未完
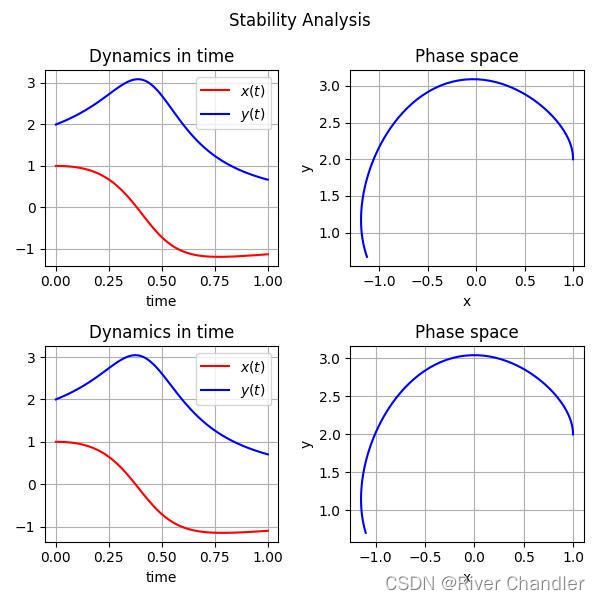
相空间的绘制
我们随机选一个方程,随机选的,不是有数学手册吗,一般来说考题不可能出数学手册上的例子
import scipy.integrate as si
import matplotlib.pyplot as plt
import numpy as np

## dx/dt = x**2-y**2+x+y
## dy/dt = x*y**2 - x**2*y

f  = lambda x,y:x**2-y**2+x+y
g  = lambda x,y:x*y**2 - x**2*y


dt = 0.01
time_start = 0
time_end   = 1
time = np.arange(time_start,time_end+dt,dt)

def system_Euler():
    global f
    global g
    global time

    x = np.zeros(time.size)
    y = np.zeros(time.size)
    x[0],y[0] = 1,2
    for i in range(1,len(time)):
        x[i] = x[i-1]+(f(x[i-1],y[i-1]))*dt
        y[i] = y[i-1]+(g(x[i-1],y[i-1]))*dt

    return x,y

def system_odeint(X,t=0):
    return np.array([X[0]**2-X[1]**2+X[0]+X[1],X[0]*X[1]**2-X[0]**2*X[1]])
system_init = np.array([1,2])

####################
x,y = system_Euler()

fig = plt.figure(figsize=(6,6),tight_layout=True)
fig.suptitle("Stability Analysis")

ax1 = plt.subplot(221)

ax1.plot(time,x, 'r-', label='$x(t)$')
ax1.plot(time,y, 'b-', label='$y(t)$')
ax1.set_title("Dynamics in time")
ax1.set_xlabel("time")
ax1.grid()
ax1.legend()

ax2 = plt.subplot(222)
ax2.plot(x,y,color="blue")
ax2.set_xlabel("x")
ax2.set_ylabel("y")
ax2.set_title("Phase space")
ax2.grid()

#####################33
X,infodict = si.odeint(system_odeint,system_init,time,full_output=True)
x,y = X.T

ax3 = plt.subplot(223)

ax3.plot(time,x, 'r-', label='$x(t)$')
ax3.plot(time,y, 'b-', label='$y(t)$')
ax3.set_title("Dynamics in time")
ax3.set_xlabel("time")
ax3.grid()
ax3.legend()

ax4 = plt.subplot(224)
ax4.plot(x,y,color="blue")
ax4.set_xlabel("x")
ax4.set_ylabel("y")
ax4.set_title("Phase space")
ax4.grid()


plt.savefig("0.jpg")
plt.pause(0.01)
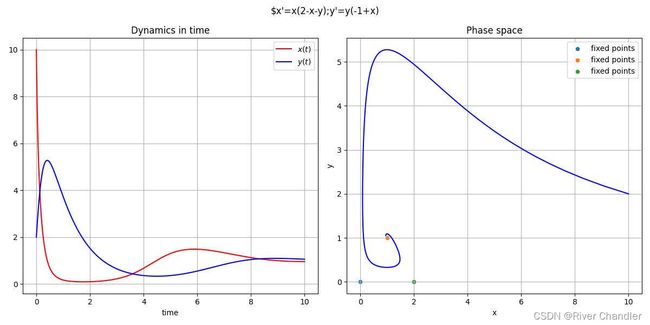
一阶微分方程的稳定点
import scipy.integrate as si
import matplotlib.pyplot as plt
import numpy as np
import sympy as sy
import copy
## dx/dt = 2*x - x**2 - x*y
## dy/dt = x*y - y

f  = lambda X:X[0]*2 - X[0]**2 - X[0]*X[1]
g  = lambda X:-X[1] + X[0]*X[1]

dt = 0.01
time_start = 0
time_end   = 10
time = np.arange(time_start,time_end+dt,dt)
system_init = np.array([10,2])

def system_odeint(X,t=0):
    global f
    global g
    return np.array([f(X),g(X)])

fig = plt.figure(figsize=(12,6),tight_layout=True)
fig.suptitle("$x'=x(2-x-y);y'=y(-1+x)")

X,infodict = si.odeint(system_odeint,system_init,time,full_output=True)
x,y = X.T


def find_fixed_points():
    global f
    global g
    global X
    r = sy.symbols("r")
    c = sy.symbols("c")
    R = sy.Function("R")
    C = sy.Function("C")
    R = 2*r - r**2 -r*c
    C = -c + r*c
    REqual = sy.Eq(R,0)
    CEqual = sy.Eq(C,0)

    return sy.solve((REqual,CEqual),r,c)

ax1 = plt.subplot(121)
ax1.plot(time,x, 'r-', label='$x(t)$')
ax1.plot(time,y, 'b-', label='$y(t)$')
ax1.set_title("Dynamics in time")
ax1.set_xlabel("time")
ax1.grid()
ax1.legend()

ax2 = plt.subplot(122)
ax2.plot(x,y,color="blue")
ax2.set_xlabel("x")
ax2.set_ylabel("y")
ax2.set_title("Phase space")
ax2.grid()
fixed_points = find_fixed_points()
for point in fixed_points:
    ax2.scatter(point[0],point[1],s=20,label="fixed points")
ax2.legend()

plt.savefig("0.jpg")
plt.pause(0.01)
微分方程稳定性的理论分析
李雅普诺夫先生,一个很棒的人
一阶自洽微分方程平衡点稳定性的结论
设有微分方程![]() ,若等号右端不显含自变量t,则称之自治方程。
,若等号右端不显含自变量t,则称之自治方程。
代数方程![]() 的实根
的实根![]() 称为方程的平衡点(奇点,奇解)
称为方程的平衡点(奇点,奇解)
二阶自洽微分方程平衡点稳定性的结论
一阶自洽线性常系数方程组
显然,方程组有唯一平衡点,假定
![]()
特征方程:
特征根:
|
|
平衡点类型 |
稳定性 |
|
|
稳定结点 |
稳定 |
|
|
不稳定结点 |
不稳定 |
|
|
鞍点 |
不稳定 |
|
|
稳定退化结点 |
稳定 |
|
|
不稳定退化结点 |
不稳定 |
|
|
稳定焦点 |
稳定 |
|
|
不稳定焦点 |
不稳定 |
|
|
中心 |
不稳定 |
一个典型的非线性振动系统
![]()
显然他可以转换成一个近可积哈密顿系统
import matplotlib.pyplot as plt
import numpy as np
from scipy.integrate import odeint as sio
from numpy.linalg import solve as sol
import random
random.seed(0)


dt = 0.001
time_start = 0
time_end = 2
time = np.arange(time_start,time_end+dt,dt)


def RK4(diff,time):
    global dt
    global init
    X = np.zeros((time.size,len(init)))
    X[0] = init
    for i in range(time.size-1):
        s0 = diff(time[i],X[i])
        s1 = diff(time[i]+dt/2,X[i]+dt*s0/2.)
        s2 = diff(time[i]+dt/2,X[i]+dt*s1/2.)
        s3 = diff(time[i+1],X[i]+dt*s2)
        X[i+1] = X[i] + dt*(s0+2*(s1+s2)+s3)/6.
    return time,X

def diff(time,Xi):
    xi,yi = Xi
    epision = 0.1
    global omega
    diffxi = yi
    diffyi = xi**2 - xi + epision*np.cos(omega*time)
    return np.array([diffxi,diffyi])


omega = 0.4
createvar = locals()
for i in range(20):
    init = np.array([1+(i>0)*random.uniform(0,0.01),1+(i>0)*random.uniform(0,0.01)])
    createvar["t"+str(i)],createvar["X"+str(i)] = RK4(diff,time)

for i in range(20):
    plt.plot(eval("X"+str(i))[:,0],eval("X"+str(i))[:,1])#,label="omega:"+str(round(omega,2)))

plt.legend()

plt.pause(0.01)


