【金融】【python】三因子(three factor)简单模型实证
三因子 three factor 简单模型实证
- 三因子模型实证
本文章原用于financial asset pricing课程,代码部分参考http://www.rhd361.com/special/news?id=3557bb1468c34b48b174f617c5415df0
三因子模型实证
# XXX: 发现参考的源代码有很大的问题,他用%m-%Y来索引排序明显不对啊
# 使用总市值加权计算

import pandas as pd
import numpy as np
import matplotlib.pyplot as plt
import seaborn as sns

%matplotlib inline
%config InlineBackend.figure_format = 'svg'

path = "./thrFactorData/STK_MKT_ThrfacDay.xlsx";
data_sample = pd.read_excel(path, skiprows=[1,2]);
data_sample.head()

def handleMonthR(local, Sname):
    path = "./"+local+".xlsx";
    data_temp = pd.read_excel(path, skiprows=[0,1,2,3], usecols=[0,1,2,3,4,5],
                             names=['date','t1','t2','t3','t4','r'],skipfooter=1);
    # data_temp = data_temp.replace('/','-');
    data_temp['datetime'] = pd.to_datetime(data_temp['date']);
    data_temp['date_index'] = data_temp['datetime'].apply(lambda x : x.strftime('%Y-%m'));
    data_temp.set_index('date_index',inplace=True)
    data_temp.sort_index(inplace=True)
    data_sep = data_temp.loc[:,['r']]
    data_sep.rename(columns={'r': Sname}, inplace=True)
    return data_sep
# 准备股票数据:
share_code = ["000002","000725","002024","600276","600848"];
share_name = ["wanke","JDFang","suning","hengrui","SHLinGang"];


data_sep = handleMonthR(share_code[0], share_name[0]);

data_sep = pd.merge(handleMonthR(share_code[1], share_name[1]), data_sep, right_index=True, left_index=True, sort=True, how='inner');
data_sep = pd.merge(handleMonthR(share_code[2], share_name[2]), data_sep, right_index=True, left_index=True, sort=True, how='inner');
data_sep = pd.merge(handleMonthR(share_code[3], share_name[3]), data_sep, right_index=True, left_index=True, sort=True, how='inner');
data_sep = pd.merge(handleMonthR(share_code[4], share_name[4]), data_sep, right_index=True, left_index=True, sort=True, how='inner');

data_sep.head()

data_sample.dropna(how="any", inplace=True);
data_sample.info()

data_sample['date'] = pd.to_datetime(data_sample['TradingDate']);
data_sample['date_index'] = data_sample['date'].apply(lambda x : x.strftime('%Y-%m'))
data_sample.set_index('date_index',inplace=True)
data_sample.sort_index(inplace=True)
# data_sample.drop(["TradingDate"],axis=1,inplace=True)
data_sample.head()

# P9705: 创业板;P9706: 综合A股市场;P9707: 综合B股市场;P9709: 综合A股和创业板; P9710: 综合AB股和创
p9706 = data_sample.loc[data_sample["MarkettypeID"].isin(["P9706"]),["RiskPremium2","SMB2","HML2","date"]]
p9706.info()

p9706['year'] = p9706['date'].apply(lambda x: x.year)
p9706['month'] = p9706['date'].apply(lambda x: x.month)
p9706['day'] = p9706['date'].apply(lambda x: x.day)
p9706 = p9706.groupby(['year', 'month']).apply(lambda t: t[t.day == t.day.max()]).reset_index(drop = True)

p9706['date_index'] = p9706['date'].apply(lambda x : x.strftime('%Y-%m'))
p9706.set_index('date_index',inplace=True)
p9706.sort_index(inplace=True)

# TODO: 不知道为什么drop year 和 month、day会删没了
# p9706 = p9706.drop(['year','month'], axis=1, inplace=True)

plt.title('Three Factor - Total market capitalization weightin')
plt.plot(p9706.values[:,3],p9706.values[:,0])
plt.plot(p9706.values[:,3],p9706.values[:,1])
plt.plot(p9706.values[:,3],p9706.values[:,2])
plt.legend(['Rp','SMB','HML'])
plt.show()

p9706 = p9706.loc[:,['RiskPremium2','SMB2','HML2']]
p9706.head()


import matplotlib.pyplot as plt
%matplotlib inline
%config InlineBackend.figure_format = 'svg'

# 准备无风险利率df
path = "./RESSET债券--月无风险收益率.xlsx";
data_rft = pd.read_excel(path, skiprows=[],names=['date','yy','mm','rft']);

data_rft['date_index'] = data_rft['date'].apply(lambda x : x.strftime('%Y-%m'));
data_rft.set_index('date_index',inplace=True)
data_rft.sort_index(inplace=True)

plt.title('Rft')
plt.plot(data_rft.values[:,0],data_rft.values[:,3])
plt.show()

data_rft = data_rft.loc[:,['date','rft']]
data_rft.head()

finalData = pd.merge(p9706, data_sep, right_index=True, left_index=True, sort=True, how='inner');
finalData = pd.merge(finalData, data_rft, right_index=True, left_index=True, sort=True, how='inner');
# finalData['wanke'] = finalData['r'] - finalData['rft'];
share_name = ["wanke","JDFang","suning","hengrui","SHLinGang"];

for i in share_name:
    finalData[i] = finalData[i] - finalData['rft'];

print(finalData.head())

plt.title('Shares')
plt.plot(finalData.values[:,8],finalData.values[:,3])
plt.plot(finalData.values[:,8],finalData.values[:,4])
plt.plot(finalData.values[:,8],finalData.values[:,5])
plt.plot(finalData.values[:,8],finalData.values[:,6])
plt.plot(finalData.values[:,8],finalData.values[:,7])
plt.legend(share_name)
plt.show()

finalData.corr()

import statsmodels.api as sm
x = finalData[["RiskPremium2","SMB2","HML2"]].values;
X = sm.add_constant(x);
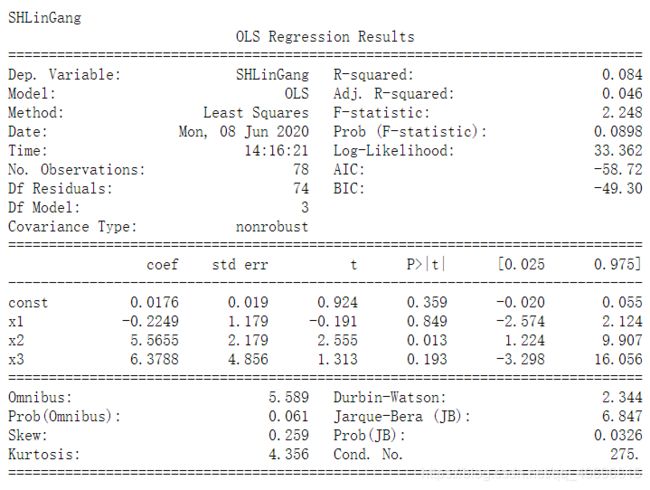
share_name = ["wanke","JDFang","suning","hengrui","SHLinGang"];
for i in share_name:
y = finalData[i];
model = sm.OLS(y, X)
results = model.fit()
print(i)
print(results.summary())
print()


plt.title('share')
plt.plot(finalData.values[:,8],finalData.values[:,3])
plt.plot(finalData.values[:,8],finalData.values[:,4])
plt.plot(finalData.values[:,8],finalData.values[:,5])
plt.plot(finalData.values[:,8],finalData.values[:,6])
plt.plot(finalData.values[:,8],finalData.values[:,7])
plt.plot(finalData.values[:,8], finalData.values[:,1])
plt.plot(finalData.values[:,8], finalData.values[:,2])
plt.legend(["wanke","JDFang","suning","hengrui","SHLinGang",'Rp','SML'])
plt.show()

import statsmodels.api as sm

x = finalData[["RiskPremium1","SMB1"]].values;
X = sm.add_constant(x);
y = finalData['wanke'];
model = sm.OLS(y, X)
results = model.fit()

print(results.summary())
