时间序列 arima_时间序列-ARIMA的变化

时间序列 arima
时间序列-ARIMA的变化 (Time Series - Variations of ARIMA)
In the previous chapter, we have now seen how ARIMA model works, and its limitations that it cannot handle seasonal data or multivariate time series and hence, new models were introduced to include these features.
在上一章中,我们现在看到了ARIMA模型的工作原理,以及它不能处理季节性数据或多元时间序列的局限性,因此引入了包含这些功能的新模型。
A glimpse of these new models is given here −
这些新模型的概览在这里给出-
向量自回归(VAR) (Vector Auto-Regression (VAR))
It is a generalized version of auto regression model for multivariate stationary time series. It is characterized by ‘p’ parameter.
它是用于多元平稳时间序列的自动回归模型的通用版本。 它以“ p”参数为特征。
向量移动平均线(VMA) (Vector Moving Average (VMA))
It is a generalized version of moving average model for multivariate stationary time series. It is characterized by ‘q’ parameter.
它是用于多元平稳时间序列的移动平均模型的广义版本。 它以“ q”参数为特征。
向量自回归移动平均值(VARMA) (Vector Auto Regression Moving Average (VARMA))
It is the combination of VAR and VMA and a generalized version of ARMA model for multivariate stationary time series. It is characterized by ‘p’ and ‘q’ parameters. Much like, ARMA is capable of acting like an AR model by setting ‘q’ parameter as 0 and as a MA model by setting ‘p’ parameter as 0, VARMA is also capable of acting like an VAR model by setting ‘q’ parameter as 0 and as a VMA model by setting ‘p’ parameter as 0.
它是VAR和VMA的组合,以及用于多元平稳时间序列的ARMA模型的广义版本。 它的特征是“ p”和“ q”参数。 很像,ARMA可以通过将“ q”参数设置为0来充当AR模型,而通过将“ p”参数设置为0来作为MA模型,VARMA也可以通过设置“ q”参数来充当VAR模型。通过将“ p”参数设置为0,将其设置为0并作为VMA模型。
In [209]:
在[209]中:
df_multi = df[['T', 'C6H6(GT)']]
split = len(df) - int(0.2*len(df))
train_multi, test_multi = df_multi[0:split], df_multi[split:]
In [211]:
在[211]中:
from statsmodels.tsa.statespace.varmax import VARMAX

model = VARMAX(train_multi, order = (2,1))
model_fit = model.fit()
c:\users\naveksha\appdata\local\programs\python\python37\lib\site-packages\statsmodels\tsa\statespace\varmax.py:152:
   EstimationWarning: Estimation of VARMA(p,q) models is not generically robust,
   due especially to identification issues.
   EstimationWarning)
c:\users\naveksha\appdata\local\programs\python\python37\lib\site-packages\statsmodels\tsa\base\tsa_model.py:171:
   ValueWarning: No frequency information was provided, so inferred frequency H will be used.
  % freq, ValueWarning)
c:\users\naveksha\appdata\local\programs\python\python37\lib\site-packages\statsmodels\base\model.py:508:
   ConvergenceWarning: Maximum Likelihood optimization failed to converge. Check mle_retvals
  "Check mle_retvals", ConvergenceWarning)
In [213]:
在[213]中:
predictions_multi = model_fit.forecast( steps=len(test_multi))
c:\users\naveksha\appdata\local\programs\python\python37\lib\site-packages\statsmodels\tsa\base\tsa_model.py:320:
   FutureWarning: Creating a DatetimeIndex by passing range endpoints is deprecated.  Use `pandas.date_range` instead.
   freq = base_index.freq)
c:\users\naveksha\appdata\local\programs\python\python37\lib\site-packages\statsmodels\tsa\statespace\varmax.py:152:
   EstimationWarning: Estimation of VARMA(p,q) models is not generically robust, due especially to identification issues.
   EstimationWarning)
In [231]:
在[231]中:
plt.plot(train_multi['T'])
plt.plot(test_multi['T'])
plt.plot(predictions_multi.iloc[:,0:1], '--')
plt.show()

plt.plot(train_multi['C6H6(GT)'])
plt.plot(test_multi['C6H6(GT)'])
plt.plot(predictions_multi.iloc[:,1:2], '--')
plt.show()

The above code shows how VARMA model can be used to model multivariate time series, although this model may not be best suited on our data.
上面的代码显示了如何使用VARMA模型对多元时间序列进行建模,尽管该模型可能并非最适合我们的数据。
具有外生变量的VARMA(VARMAX) (VARMA with Exogenous Variables (VARMAX))
It is an extension of VARMA model where extra variables called covariates are used to model the primary variable we are interested it.
它是VARMA模型的扩展,其中使用了称为协变量的额外变量来对我们感兴趣的主要变量进行建模。
季节性自回归综合移动平均线(SARIMA) (Seasonal Auto Regressive Integrated Moving Average (SARIMA))
This is the extension of ARIMA model to deal with seasonal data. It divides the data into seasonal and non-seasonal components and models them in a similar fashion. It is characterized by 7 parameters, for non-seasonal part (p,d,q) parameters same as for ARIMA model and for seasonal part (P,D,Q,m) parameters where ‘m’ is the number of seasonal periods and P,D,Q are similar to parameters of ARIMA model. These parameters can be calibrated using grid search or genetic algorithm.
这是ARIMA模型用于处理季节性数据的扩展。 它将数据分为季节和非季节成分,并以类似的方式对其进行建模。 它的特征在于7个参数,对于非季节性部分(p,d,q)参数与ARIMA模型相同,对于季节性部分(P,D,Q,m)参数,其中'm'是季节性周期数, P,D,Q与ARIMA模型的参数相似。 这些参数可以使用网格搜索或遗传算法进行校准。
具有外生变量的SARIMA(SARIMAX) (SARIMA with Exogenous Variables (SARIMAX))
This is the extension of SARIMA model to include exogenous variables which help us to model the variable we are interested in.
这是SARIMA模型的扩展,其中包括外生变量,这些变量有助于我们对感兴趣的变量进行建模。
It may be useful to do a co-relation analysis on variables before putting them as exogenous variables.
在将变量作为外生变量之前,对它们进行关联分析可能会很有用。
In [251]:
在[251]中:
from scipy.stats.stats import pearsonr
x = train_multi['T'].values
y = train_multi['C6H6(GT)'].values

corr , p = pearsonr(x,y)
print ('Corelation Coefficient =', corr,'\nP-Value =',p)
Corelation Coefficient = 0.9701173437269858
P-Value = 0.0
Pearson’s Correlation shows a linear relation between 2 variables, to interpret the results, we first look at the p-value, if it is less that 0.05 then the value of coefficient is significant, else the value of coefficient is not significant. For significant p-value, a positive value of correlation coefficient indicates positive correlation, and a negative value indicates a negative correlation.
皮尔逊相关性显示2个变量之间的线性关系,为了解释结果,我们首先查看p值,如果小于0.05,则系数的值显着,否则系数的值不显着。 对于显着的p值,相关系数的正值表示正相关,而负值表示负相关。
Hence, for our data, ‘temperature’ and ‘C6H6’ seem to have a highly positive correlation. Therefore, we will
因此,对于我们的数据,“温度”和“ C6H6”似乎具有高度正相关。 因此,我们将
In [297]:
在[297]中:
from statsmodels.tsa.statespace.sarimax import SARIMAX

model = SARIMAX(x, exog = y, order = (2, 0, 2), seasonal_order = (2, 0, 1, 1), enforce_stationarity=False, enforce_invertibility = False)
model_fit = model.fit(disp = False)
c:\users\naveksha\appdata\local\programs\python\python37\lib\site-packages\statsmodels\base\model.py:508:
   ConvergenceWarning: Maximum Likelihood optimization failed to converge. Check mle_retvals
   "Check mle_retvals", ConvergenceWarning)
In [298]:
在[298]中:
y_ = test_multi['C6H6(GT)'].values
predicted = model_fit.predict(exog=y_)
test_multi_ = pandas.DataFrame(test)
test_multi_['predictions'] = predicted[0:1871]
In [299]:
在[299]中:
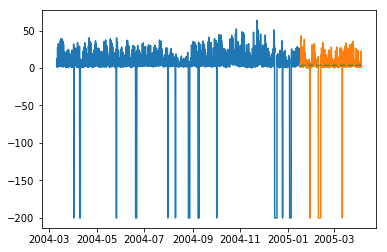
plt.plot(train_multi['T'])
plt.plot(test_multi_['T'])
plt.plot(test_multi_.predictions, '--')
Out[299]:
出[299]:
[]
The predictions here seem to take larger variations now as opposed to univariate ARIMA modelling.
与单变量ARIMA建模相反,此处的预测现在似乎需要更大的变化。
Needless to say, SARIMAX can be used as an ARX, MAX, ARMAX or ARIMAX model by setting only the corresponding parameters to non-zero values.
不用说,通过仅将相应参数设置为非零值,SARIMAX可以用作ARX,MAX,ARMAX或ARIMAX模型。
分数自回归综合移动平均线(FARIMA) (Fractional Auto Regressive Integrated Moving Average (FARIMA))
At times, it may happen that our series is not stationary, yet differencing with ‘d’ parameter taking the value 1 may over-difference it. So, we need to difference the time series using a fractional value.
有时可能会发生我们的序列不稳定的情况,但是与“ d”参数取值1的差异可能会使它过分差异。 因此,我们需要使用小数值来区分时间序列。
In the world of data science there is no one superior model, the model that works on your data depends greatly on your dataset. Knowledge of various models allows us to choose one that work on our data and experimenting with that model to achieve the best results. And results should be seen as plot as well as error metrics, at times a small error may also be bad, hence, plotting and visualizing the results is essential.
在数据科学领域,没有一种上乘的模型,对您的数据起作用的模型在很大程度上取决于您的数据集。 对各种模型的了解使我们可以选择一种可以处理数据的模型,并对该模型进行试验以获得最佳结果。 结果应视为绘图以及误差度量,有时小误差也可能是不好的,因此,绘图和可视化结果至关重要。
In the next chapter, we will be looking at another statistical model, exponential smoothing.
在下一章中,我们将研究另一种统计模型,即指数平滑。
翻译自: https://www.tutorialspoint.com/time_series/time_series_variations_of_arima.htm
时间序列 arima