单细胞分析实录(14): 细胞类型注释的另一种思路 — CellID
之前写过一篇细胞类型注释的推文:单细胞分析实录(7): 差异表达分析/细胞类型注释,里面介绍了细胞类型注释的两种思路。在谈到自动注释时,我们基本都会用SingleR这个软件,类似的软件还有很多,原理上可能五花八门,但表现不一定有SingleR好。很多软件在做注释时会基于某个细胞和参考细胞表达谱的相似性,今天看到的这个软件使用的是另一种思路:将某个细胞的特征基因集与表征细胞类型的参考基因集做富集分析,当在某个细胞类型的基因集上显著富集时,就定义为这个细胞类型(和GO富集很像)。所以这种方法的关键点是:找单个细胞的特征基因集,以及找细胞类型的参考基因集。
CellID发表在NBT上面:Gene signature extraction and cell identity recognition at the single-cell level with Cell-ID。解决的主要是找单个细胞的特征基因集这个问题。
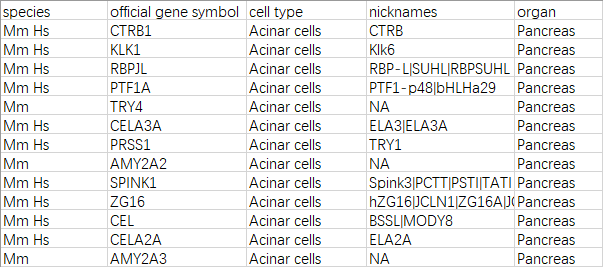
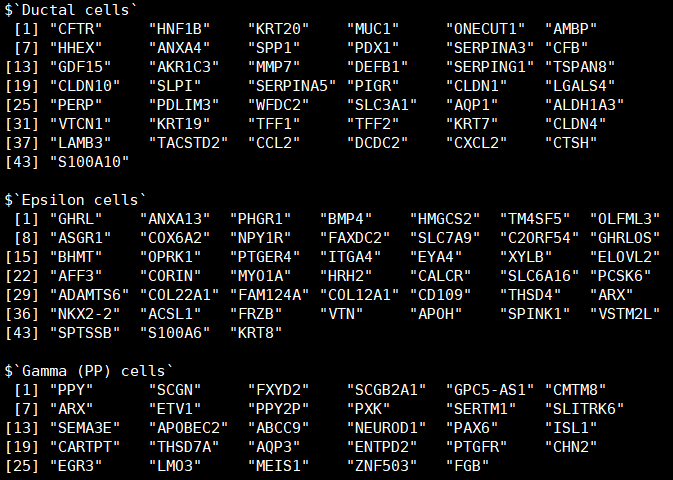
软件的官方文档:https://bioconductor.org/packages/devel/bioc/vignettes/CelliD/inst/doc/BioconductorVignette.html 有详细的演示,并且在选取细胞类型参考基因集时,使用的是网站PanglaoDB:https://panglaodb.se/index.html 这个网站有人和小鼠各种细胞类型的marker,这是下载链接:https://panglaodb.se/markers/PanglaoDB_markers_27_Mar_2020.tsv.gz 比我之前整理的详细得多。 
题外话:在单细胞分析实录(7)发布之后,公众号后台断断续续收到几十位读者询问marker清单的信息,希望这个更全面的清单能帮助到你。
下面我简单演示一下CellID的用法:
library(CellID)
library(Seurat)
library(tidyverse)

#获取原始表达矩阵
BaronMatrix   <- readRDS(url("https://storage.googleapis.com/cellid-cbl/BaronMatrix.rds"))
#仅考虑编码蛋白质的基因
data("HgProteinCodingGenes")
BaronMatrixProt <- BaronMatrix[rownames(BaronMatrix) %in% HgProteinCodingGenes,]

#这几步类似Seurat的标准流程
Baron <- CreateSeuratObject(counts = BaronMatrixProt, project = "Baron", min.cells = 5)
Baron <- NormalizeData(Baron)
Baron <- ScaleData(Baron, features = rownames(Baron))
Baron <- RunMCA(Baron) #该软件的主要分析函数,将细胞和基因同时降维到一个空间,离细胞近的基因被定义为细胞的特征基因——令人窒息的操作

#下载参考基因集
panglao <- read_tsv("https://panglaodb.se/markers/PanglaoDB_markers_27_Mar_2020.tsv.gz")
#根据器官过滤,示例数据就是胰腺的
panglao_pancreas <- panglao %>% filter(organ == "Pancreas")
#物种包含人
panglao_pancreas <- panglao_pancreas %>%  filter(str_detect(species,"Hs"))
#下面两步会得到一个列表,列表的每一个元素是由基因集构成的字符向量,且每个元素被命名为对应的细胞类型的名字
panglao_pancreas <- panglao_pancreas %>%
  group_by(`cell type`) %>%
  summarise(geneset = list(`official gene symbol`))
pancreas_gs <- setNames(panglao_pancreas$geneset, panglao_pancreas$`cell type`)
#富集分析,用的超几何检验
HGT_pancreas_gs <- RunCellHGT(Baron, pathways = pancreas_gs, dims = 1:50, n.features = 200) #每个细胞选200个特征基因富集分析之后会返回一个矩阵,矩阵中的每一个值表示p值在校正之后,求-log10,即-log10 corrected p-value,当然这个值越大越好。
> HGT_pancreas_gs[1:4,1:4]
4 x 4 sparse Matrix of class "dgCMatrix"
             human1_lib1.final_cell_0001 human1_lib1.final_cell_0002
Acinar cells                  60.6897442                  63.2674918
Alpha cells                    0.1241303                   0.1241303
Beta cells                     .                           .
Delta cells                    .                           .
             human1_lib1.final_cell_0003 human1_lib1.final_cell_0004
Acinar cells                  58.1720116                  63.2674918
Alpha cells                    0.1910771                   0.1770659
Beta cells                     0.4326425                   0.1770659
Delta cells                    .                           .

pancreas_gs_prediction <- rownames(HGT_pancreas_gs)[apply(HGT_pancreas_gs, 2, which.max)]
#矩阵的每一列依次:判断是否是最大值,得到一列布尔值,结合矩阵的行名会返回行名中的一个元素(也就是最有可能的细胞类型)。
#所有列运行完了之后会得到所有细胞最可能的注释
pancreas_gs_prediction_signif <- ifelse(apply(HGT_pancreas_gs, 2, max)>2, yes = pancreas_gs_prediction, "unassigned")
#如果`-log10 corrected p-value`的值小于等于2,则认为不显著,注释更正为"unassigned"
Baron$pancreas_gs_prediction <- pancreas_gs_prediction_signif

head([email protected],2)
                            orig.ident nCount_RNA nFeature_RNA
human1_lib1.final_cell_0001     human1      21956         3362
human1_lib1.final_cell_0002     human1      27309         4009
                            pancreas_gs_prediction
human1_lib1.final_cell_0001           Acinar cells
human1_lib1.final_cell_0002           Acinar cells
到这儿,细胞类型预测算结束了。再来用真正的细胞类型(也可以是手动注释的结果),评估一下软件预测出来的准不准。走Seurat标准流程:
#加载预先知道的注释信息
BaronMetaData <- readRDS(url("https://storage.googleapis.com/cellid-cbl/BaronMetaData.rds"))
[email protected]=merge([email protected],BaronMetaData,by="row.names")
rownames([email protected])[email protected]$Row.names
[email protected]$Row.names=NULL
head([email protected],2)
                            orig.ident nCount_RNA nFeature_RNA
human1_lib1.final_cell_0001     human1      21956         3362
human1_lib1.final_cell_0002     human1      27309         4009
                            pancreas_gs_prediction      donor    cell.type
human1_lib1.final_cell_0001           Acinar cells GSM2230757 Acinar cells
human1_lib1.final_cell_0002           Acinar cells GSM2230757 Acinar cells

Baron <- FindVariableFeatures(Baron, selection.method = "vst", nfeatures = 2000)
Baron <- ScaleData(Baron)
Baron <- RunPCA(Baron, npcs = 50, verbose = FALSE)
Baron <- FindNeighbors(Baron, dims = 1:30)
Baron <- FindClusters(Baron, resolution = 0.5)
Baron <- RunUMAP(Baron, dims = 1:30)
Baron <- RunTSNE(Baron, dims = 1:30)

library(cowplot)
p1 <- DimPlot(Baron, reduction = "tsne", group.by = "cell.type", pt.size=0.5, label = TRUE,repel = TRUE)
p2 <- DimPlot(Baron, reduction = "tsne", group.by = "pancreas_gs_prediction", pt.size=0.5, label = TRUE,repel = TRUE)
fig_tsne <- plot_grid(p1, p2, labels = c('cell.type','pancreas_gs_prediction'),align = "v",ncol = 2)
ggsave(filename = "tsne.pdf", plot = fig_tsne, device = 'pdf', width = 40, height = 15, units = 'cm')这种细胞注释方法非常依赖于细胞类型的参考基因集的质量,我拿自己的数据集跑这个软件,并没有该软件的示例数据效果好,原因就是前面提到的PanglaoDB网站中我这个方向的参考数据质量不高。大家还知道类似的提供了细胞类型及对应的基因集网站吗?欢迎讨论,集思广益,我会在之后的推文中列出大家推荐的网站。
另外,这种用富集来注释的思路可以延伸一下,比如对于某个cluster不太清楚是什么类型,可以找完差异基因后,用细胞类型参考基因集做富集分析,来定义cluster类型。
因水平有限,有错误的地方,欢迎批评指正!

