【数据挖掘入门】数据可视化
导入数据
import numpy as np
import pandas as pd
import matplotlib.pyplot as plt
import seaborn as sns

train_data_file = "./zhengqi_train.txt"
test_data_file = './zhengqi_test.txt'

train_data = pd.read_csv(train_data_file, sep='\t', encoding='utf8')
test_data = pd.read_csv(test_data_file, sep='\t', encoding='utf8')
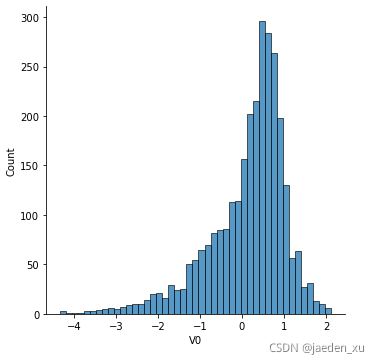
1 直方图
plt.figure(figsize=(4,4),dpi=150)
sns.displot(train_data['V0'].dropna())
plt.xlabel('V0')
2折线图
3 箱线图
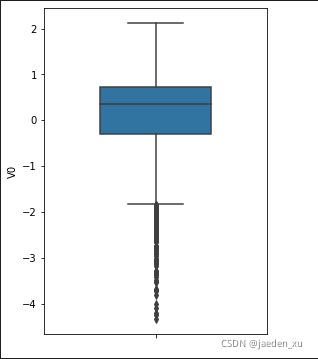
单个箱线图
fig = plt.figure(figsize=(4,6))
sns.boxplot(y = train_data['V0'],orient="v",width=0.5)
多个箱线图组合
column = train_data.columns.tolist()[:39]
fig = plt.figure(figsize=(80, 60))
for i in range(38):
    plt.subplot(7, 8, i+1)
    sns.boxplot(y = train_data[column[i]],width=0.5)
    plt.ylabel(column[i],fontsize=36)
plt.show()
4 相关性热力图
train_corr = train_data.corr()
ax = plt.subplots(figsize=(20,16))
ax = sns.heatmap(train_corr,annot=True)
5 小提琴图
a = plt.figure(figsize=(10,10))
scatter_para = {'marker':'.', 's':3, 'alpha':0.3}
line_kws = {'color':'k'}
plt.subplot(2,2,1)
plt.title('The distrubution of total purchase')
sns.violinplot(x='weekday', y='total_purchase_amt', data = total_balance_1, scatter_kws=scatter_para, line_kws=line_kws)
6 Q—Q图
7 KDE核密度图
lt.figure(figsize=(8,4),dpi=150)
ax = sns.kdeplot(train_data['V0'], color="Red", shade=True)
ax = sns.kdeplot(test_data['V0'], color="Blue", shade=True)
ax.set_xlabel('V0')
ax.set_ylabel('Frequency')
ax = ax.legend(["train", "test"])
dist_cols = 6
dist_rows = len(test_data.columns)
plt.figure(figsize=(4 * dist_cols, 4 * dist_rows))
i = 1
for col in test_data.columns:
    ax = plt.subplot(dist_rows, dist_cols, i)
    ax = sns.kdeplot(train_data[col], color="Red", shade=True)
    ax = sns.kdeplot(test_data[col], color="Blue", shade=True)
    ax.set_xlabel(col)
    ax.set_ylabel('Frequency')
    ax = ax.legend(["train", "test"])
    i += 1
plt.show()
回归图
plt.figure(figsize=(4,4),dpi=150)
sns.regplot(x='V0', y='target', data=train_data, scatter_kws={'s':3,'alpha':0.3},line_kws={'color':'k'});
plt.xlabel('V0')
plt.ylabel('target')
fcols = 6
frows = len(train_data.columns)
plt.figure(figsize=(5*fcols,4*frows))

i=0
for col in test_data.columns:
    i += 1
    ax=plt.subplot(frows,fcols,i)
    sns.regplot(x=col, y='target', data=train_data, ax=ax, scatter_kws={'s':3,'alpha':0.3},line_kws={'color':'k'});
    plt.xlabel(col)
    plt.ylabel('target')
fig = plt.figure(figsize=(15,12))
explode = (0, 0, 0, 0.2, 0.3, 0.3, 0.2, 0.1)
plt.pie(_df["id"],  labels=_df["group_name"], autopct='%1.2f%%', startangle=160, explode=explode)
plt.tight_layout()
plt.show()
# 画出每日总购买与赎回量的时间序列图

fig = plt.figure(figsize=(20,6))
plt.plot(total_balance['date'], total_balance['total_purchase_amt'],label='purchase')
plt.plot(total_balance['date'], total_balance['total_redeem_amt'],label='redeem')

plt.legend(loc='best')
plt.title("The lineplot of total amount of Purchase and Redeem from July.13 to Sep.14")
plt.xlabel("Time")
plt.ylabel("Amount")
plt.show()
# 画出每个翌日的数据分布于整体数据的分布图

a = plt.figure(figsize=(10,10))
scatter_para = {'marker':'.', 's':3, 'alpha':0.3}
line_kws = {'color':'k'}
plt.subplot(2,2,1)
plt.title('The distrubution of total purchase')
sns.violinplot(x='weekday', y='total_purchase_amt', data = total_balance_1, scatter_kws=scatter_para, line_kws=line_kws)
plt.subplot(2,2,2)
plt.title('The distrubution of total purchase')
sns.distplot(total_balance_1['total_purchase_amt'].dropna())
plt.subplot(2,2,3)
plt.title('The distrubution of total redeem')
sns.violinplot(x='weekday', y='total_redeem_amt', data = total_balance_1, scatter_kws=scatter_para, line_kws=line_kws)
plt.subplot(2,2,4)
plt.title('The distrubution of total redeem')
sns.distplot(total_balance_1['total_redeem_amt'].dropna())


