TensorFlow游乐园介绍及其神经网络训练过程(Matlab代码实现)
目录
1 概述
2 运行结果
3 参考文献
4 Matlab代码
1 概述
本代码是使用人工神经网络对高度非线性数据进行回归和分类的相同神经网络接口的MATLAB实现。该接口使用HG1图形系统,以便与旧版本的MATLAB兼容。该项目的第二个目的是编写一个以随机梯度下降训练人工神经网络的矢量化实现。
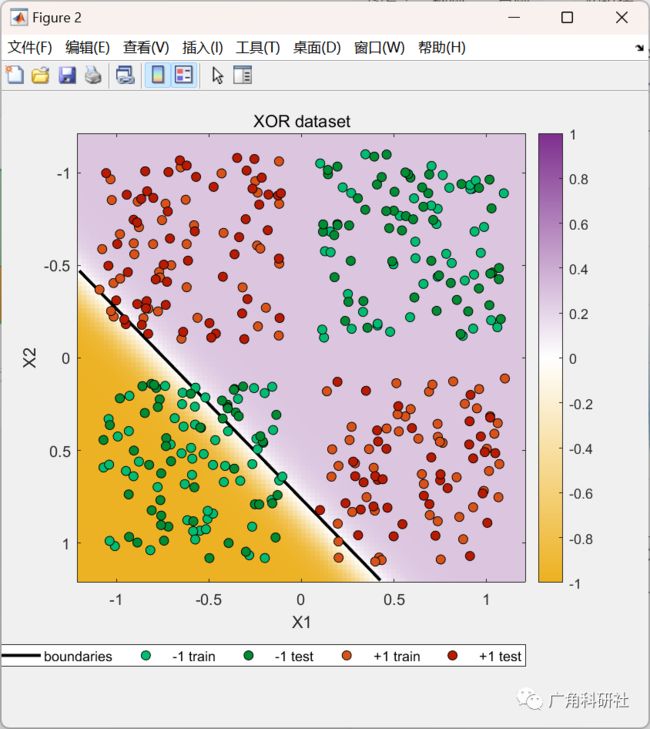
该框架的目标是随机生成的训练和测试数据,这些数据分为符合某些形状或规范的两类,并且给定神经网络的配置,目标是对这些数据进行回归或二元分类,并交互式地向用户显示结果,特别是数据的分类或回归图,以及数值性能测量,例如训练和测试损失及其在每次迭代的性能曲线上绘制的值。神经网络的体系结构是高度可配置的,因此可以立即看到体系结构中每次变化的结果。
2 运行结果
主函数部分代码:
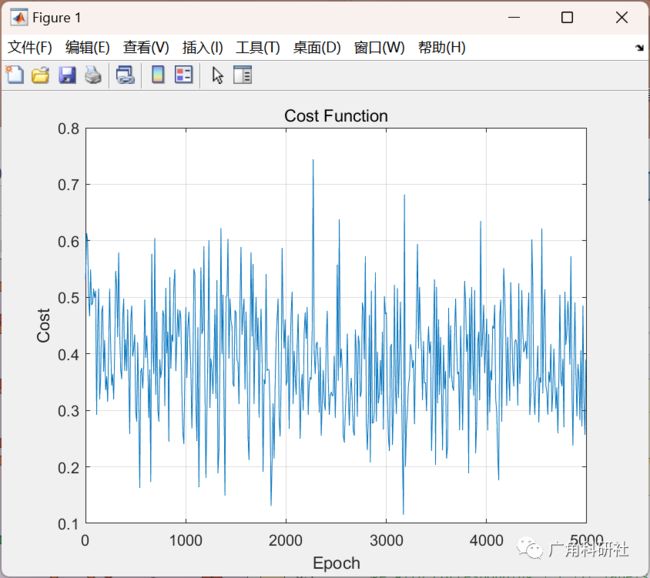
%% Data% Create XOR dataset% 2D points in [-1.1,1.1] range with corresponding {-1,+1} labelsm = 400;X = rand(m,2)*2 - 1;X = X + sign(X)*0.1;Y = (prod(X,2) >= 0)*2 - 1;whos X Y% shuffle and split into training and test setsratio = 0.5;mTrain = floor(ratio*m);mTest = m - mTrain;indTrain = randperm(m);Xtrain = X(indTrain(1:mTrain),:);Ytrain = Y(indTrain(1:mTrain));Xtest = X(indTrain(mTrain+1:end),:);Ytest = Y(indTrain(mTrain+1:end));%% Network% Create the neural networknet = NeuralNet2([size(X,2) 4 2 size(Y,2)]);net.LearningRate = 0.1;net.RegularizationType = 'L2';net.RegularizationRate = 0.01;net.ActivationFunction = 'Tanh';net.BatchSize = 10;display(net)%% Training and Testing NetworkN = 5000; % number of iterationsdisp('Training...'); ticcostVal = net.train(Xtrain, Ytrain, N);toc% compute predictionsdisp('Test...'); ticpredictTrain = sign(net.sim(Xtrain));predictTest = sign(net.sim(Xtest));toc% classification accuracyfprintf('Final cost after training: %f\n', costVal(end));fprintf('Train accuracy: %.2f%%\n', 100*sum(predictTrain == Ytrain) / mTrain);fprintf('Test accuracy: %.2f%%\n', 100*sum(predictTest == Ytest) / mTest);% plot cost function per epoch% show the cost for every 10 epochsfigure(1)plot(1:10:N, costVal(1:10:end)); grid on; box ontitle('Cost Function'); xlabel('Epoch'); ylabel('Cost')%% Result% assign green to be the points with label -1 and red to be the points with% label +1clr = [0 0.741 0.447; 0.85 0.325 0.098];% generate custom color map roughly based on the parula colour map% Varies between purple (negative values) to white (zero values) to orange% (positive values)% The color map is a 256 x 3 matrixcmap = interp1([-101], ...[0.929 0.694 0.125; 1 1 1; 0.494 0.184 0.556], linspace(-1,1,256));% classification grid over domain of data[X1,X2] = meshgrid(linspace(-1.2,1.2,100));% Use resulting trained neural network to predict each point in the% classification gridout = reshape(net.sim([X1(:) X2(:)]), size(X1));% Hard classification by the sign of the datapredictOut = sign(out);% plot predictions, with decision regions and data points overlaid% set up figurefigure(2); set(gcf, 'Position',[200200560550])imagesc(X1(1,:), X2(:,2), out)set(gca, 'CLim',[-1 1], 'ALim',[-1 1])colormap(cmap); colorbarhold on% Draw classification boundary (i.e. when the neural network output is 0)contour(X1, X2, out, [0 0], 'LineWidth',2, 'Color','k', ...'DisplayName','boundaries')% For each label (-1,+1), extract out the training and test labels classified by% the neural network and draw circles with their corresponding labelled colors.% Test set points are slightly lighter in colour in comparison to the training% data. Each circle has a black edge surrounding it.K = [-11];for ii=1:numel(K)indTrain = (Ytrain == K(ii));indTest = (Ytest == K(ii));line(Xtrain(indTrain,1), Xtrain(indTrain,2), 'LineStyle','none', ...'Marker','o', 'MarkerSize',6, ...'MarkerFaceColor',clr(ii,:), 'MarkerEdgeColor','k', ...'DisplayName',sprintf('%+d train',K(ii)))line(Xtest(indTest,1), Xtest(indTest,2), 'LineStyle','none', ...'Marker','o', 'MarkerSize',6, ...'MarkerFaceColor',brighten(clr(ii,:),-0.5), 'MarkerEdgeColor','k', ...'DisplayName',sprintf('%+d test',K(ii)))endhold off; xlabel('X1'); ylabel('X2'); title('XOR dataset')legend('show', 'Orientation','Horizontal', 'Location','SouthOutside')
3 参考文献
[1]章敏敏,徐和平,王晓洁等.谷歌TensorFlow机器学习框架及应用[J].微型机与应用,2017,36(10):58-60.
部分理论引用网络文献,若有侵权联系博主删除。

