Matplotlib学习(13)--区域填充
对曲线下面或者曲线之间进行颜色填充
(1)使用fill函数
代码如下
import matplotlib.pyplot as plt
import numpy as np

x = np.linspace(0,5*np.pi,1000);
y1 = np.sin(x)
y2 = np.sin(2*x)

plt.plot(x,y1)
plt.plot(x,y2)

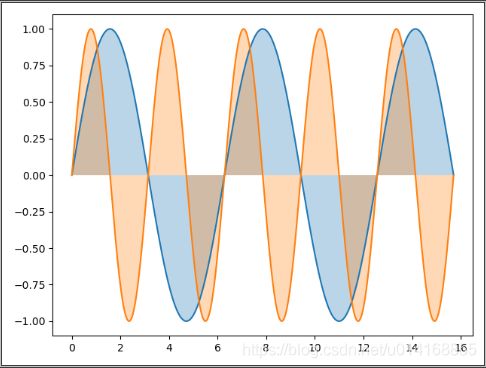
plt.fill(x,y1,alpha=0.3)
plt.fill(x,y2,alpha=0.3)

plt.show()
import matplotlib.pyplot as plt
import numpy as np

x = np.linspace(0,5*np.pi,100)
y1 = np.sin(x)
y2 = np.sin(2*x)

fig = plt.figure()
ax = fig.gca()

ax.plot(x,y1,color='r')
ax.plot(x,y2,color='g')
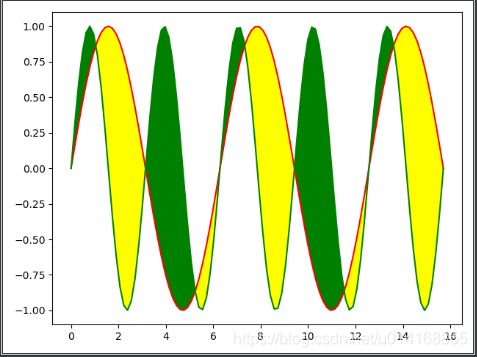
# y1>y2时候填充黄色,空隙也填充
ax.fill_between(x,y1,y2,where=y1>y2,facecolor='yellow',interpolate='True')
ax.fill_between(x,y1,y2,where=y1<y2,facecolor='green',interpolate='True')

plt.show()

