摩拜单车探索性分析
关于摩拜单车的探索性分析
数据简介
- Github
git init
git clone  github_link
随着共享经济的发展,共享单车应运而生,“行”作为四大民生需求(衣食住行)的一部分,探索其在新形态经济下的发展态势以及存在的问题尤为重要。
本项目选用摩拜单车的数据,共包含102361条摩拜单车订单记录,包含的变量有:
| 列名 | 解释说明 |
|---|---|
| orderid | 订单编号 |
| bikeid | 车辆编号 |
| userid | 用户ID |
| start_time | 骑行开始时间 |
| end_time | 骑行结束时间 |
| start_location_x | 起点维度位置 |
| start_location_y | 起点经度位置 |
| end_location_x | 终点维度位置 |
| start_location_x | 起点维度位置 |
| start_location_y | 起点经度位置 |
| end_location_x | 终点维度位置 |
| end_location_y | 终点经度位置 |
| track | 轨迹点 |
# 导入功能库
import pandas as pd
import os
import numpy as np
import matplotlib.pyplot as plt
import seaborn as sns
from folium import plugins
import folium
from IPython.display import HTML
import warnings
warnings.filterwarnings("ignore")
os.listdir('Mobike Data')
['.DS_Store',
 'MOBIKE 样本数据说明(data_description).pdf',
 'Mobike_location_heatmap.html',
 'mobike_shanghai_sample_updated.csv']
数据评估与清理
# 上载数据
mobike_df = pd.read_csv(os.path.join("Mobike Data",'mobike_shanghai_sample_updated.csv'))
# 观察并评估数据
mobike_df.head(5)
| orderid | bikeid | userid | start_time | start_location_x | start_location_y | end_time | end_location_x | end_location_y | track | |
|---|---|---|---|---|---|---|---|---|---|---|
| 0 | 78387 | 158357 | 10080 | 2016-08-20 06:57 | 121.348 | 31.389 | 2016-08-20 07:04 | 121.357 | 31.388 | 121.347,31.392#121.348,31.389#121.349,31.390#1... |
| 1 | 891333 | 92776 | 6605 | 2016-08-29 19:09 | 121.508 | 31.279 | 2016-08-29 19:31 | 121.489 | 31.271 | 121.489,31.270#121.489,31.271#121.490,31.270#1... |
| 2 | 1106623 | 152045 | 8876 | 2016-08-13 16:17 | 121.383 | 31.254 | 2016-08-13 16:36 | 121.405 | 31.248 | 121.381,31.251#121.382,31.251#121.382,31.252#1... |
| 3 | 1389484 | 196259 | 10648 | 2016-08-23 21:34 | 121.484 | 31.320 | 2016-08-23 21:43 | 121.471 | 31.325 | 121.471,31.325#121.472,31.325#121.473,31.324#1... |
| 4 | 188537 | 78208 | 11735 | 2016-08-16 07:32 | 121.407 | 31.292 | 2016-08-16 07:41 | 121.418 | 31.288 | 121.407,31.291#121.407,31.292#121.408,31.291#1... |
mobike_df.info()
RangeIndex: 102361 entries, 0 to 102360
Data columns (total 10 columns):
orderid             102361 non-null int64
bikeid              102361 non-null int64
userid              102361 non-null int64
start_time          102361 non-null object
start_location_x    102361 non-null float64
start_location_y    102361 non-null float64
end_time            102361 non-null object
end_location_x      102361 non-null float64
end_location_y      102361 non-null float64
track               102361 non-null object
dtypes: float64(4), int64(3), object(3)
memory usage: 6.6+ MB
# 更正数据类型
mobike_df.orderid = mobike_df.orderid.astype(str)
mobike_df.bikeid = mobike_df.bikeid.astype(str)
mobike_df.userid = mobike_df.userid.astype(str)
mobike_df.start_time = pd.to_datetime(mobike_df.start_time)
mobike_df.end_time = pd.to_datetime(mobike_df.end_time)
# 获取地理点
def get_loc(value):
    loc_list = []
    for item in value:
        loc = tuple([float(i) for i in item.split(',')])
        loc_list.append(loc)
    return loc_list
mobike_df.track = mobike_df.track.str.replace('\\','')
# 获取轨迹点
mobike_df.track = mobike_df.track.str.split('#').apply(get_loc)
# 根据骑行起止时间,得出骑行时长(分钟数)
mobike_df['riding_time'] = (mobike_df.end_time - mobike_df.start_time).apply(lambda x:x.total_seconds())/60
# 检查是否存在异常值
mobike_df.describe()
| start_location_x | start_location_y | end_location_x | end_location_y | riding_time | |
|---|---|---|---|---|---|
| count | 102361.000000 | 102361.000000 | 102361.000000 | 102361.000000 | 102361.000000 |
| mean | 121.454144 | 31.251740 | 121.453736 | 31.252029 | 17.195162 |
| std | 0.060862 | 0.057358 | 0.061577 | 0.057740 | 34.049919 |
| min | 121.173000 | 30.842000 | 120.486000 | 30.841000 | 1.000000 |
| 25% | 121.415000 | 31.212000 | 121.414000 | 31.212000 | 7.000000 |
| 50% | 121.456000 | 31.260000 | 121.456000 | 31.261000 | 12.000000 |
| 75% | 121.497000 | 31.294000 | 121.497000 | 31.294000 | 20.000000 |
| max | 121.970000 | 31.450000 | 121.971000 | 31.477000 | 4725.000000 |
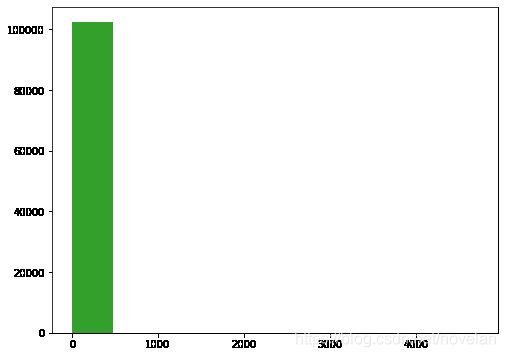
riding_time存在异常值,最大值高达4725分钟,数据差异之大不合逻辑
# 探索骑行时长的数据分布
plt.figure(figsize=(8,6))
colorful = sns.color_palette('Paired')
plt.hist(data=mobike_df,x='riding_time',color=colorful[3]);
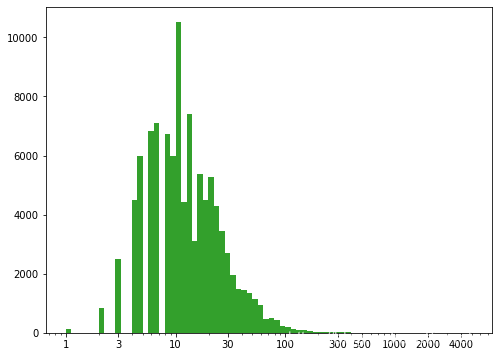
骑行时长严重右偏,存在少量较大的异常值,需要进行对数变换增加数据的粒度
# 骑行时长进行对数变换
plt.figure(figsize=(8,6))
colorful = sns.color_palette('Paired')
bin_edge = 10**np.arange(0,np.log10(mobike_df.riding_time.max())+0.05,0.05)
plt.hist(data=mobike_df,x='riding_time',bins=bin_edge,color=colorful[3])
plt.xscale('log')
plt.xticks(ticks=[1,3,10,30,100,300,500,1000,2000,4000],labels=[1,3,10,30,100,300,500,1000,2000,4000]);
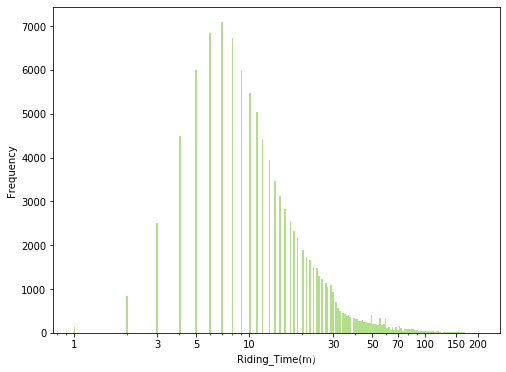
单次骑行时长主要集中在5-30分钟,整体分布形态严重右偏,数据集存在异常值,200分钟以内的骑行时长属于正常的有效时长;异常值的存在可能是由于数据录入错误,或者用户骑行结束后忘记关锁等原因导致记录的时长过长。
# 筛选有效的骑行时长的记录
mobike_df = mobike_df[mobike_df.riding_time <= 200]
mobike_df.info()
Int64Index: 102230 entries, 0 to 102360
Data columns (total 11 columns):
orderid             102230 non-null object
bikeid              102230 non-null object
userid              102230 non-null object
start_time          102230 non-null datetime64[ns]
start_location_x    102230 non-null float64
start_location_y    102230 non-null float64
end_time            102230 non-null datetime64[ns]
end_location_x      102230 non-null float64
end_location_y      102230 non-null float64
track               102230 non-null object
riding_time         102230 non-null float64
dtypes: datetime64[ns](2), float64(5), object(4)
memory usage: 7.8+ MB
mobike_df.head(2)
| orderid | bikeid | userid | start_time | start_location_x | start_location_y | end_time | end_location_x | end_location_y | track | riding_time | |
|---|---|---|---|---|---|---|---|---|---|---|---|
| 0 | 78387 | 158357 | 10080 | 2016-08-20 06:57:00 | 121.348 | 31.389 | 2016-08-20 07:04:00 | 121.357 | 31.388 | [(121.347, 31.392), (121.348, 31.389), (121.34... | 7.0 |
| 1 | 891333 | 92776 | 6605 | 2016-08-29 19:09:00 | 121.508 | 31.279 | 2016-08-29 19:31:00 | 121.489 | 31.271 | [(121.489, 31.27), (121.489, 31.271), (121.49,... | 22.0 |
mobike_df.to_csv('mobike_df_edit.csv',index=False)
from operator import itemgetter, attrgetter
# 根据起止点重排轨迹点顺序
def reorder_track(start_point,end_point,track):
    lgt1,lat1 = start_point
    lgt2,lat2 = end_point
    try:
        track.remove(start_point)
        track.remove(end_point)
    except:
        track = track
    if np.abs(lgt1 - lgt2) > np.abs(lat1 - lat2):
        if (lgt1 < lgt2):# to east
            if (lat1 < lat2): # to north
                ordered_track = [start_point] + sorted(track,key=itemgetter(0,1)) + [end_point]
            else: # to south
                s = sorted(track,key=itemgetter(1),reverse=True)
                ordered_track = [start_point] + sorted(s,key=itemgetter(0)) + [end_point]
        elif (lgt1 > lgt2): # to west
            if (lat1 < lat2): # to north
                s = sorted(track,key=itemgetter(1))
                ordered_track = [start_point] + sorted(s,key=itemgetter(0),reverse=True) + [end_point]
            else: # to south
                ordered_track = [start_point] + sorted(track,key=itemgetter(0,1),reverse=True) + [end_point]
    elif np.abs(lgt1 - lgt2) <= np.abs(lat1 - lat2):
        if (lgt1 < lgt2):# to east
            if (lat1 < lat2): # to north
                ordered_track = [start_point] + sorted(track,key=itemgetter(1,0)) + [end_point]
            else: # to south
                s = sorted(track,key=itemgetter(0))
                ordered_track = [start_point] + sorted(s,key=itemgetter(1),reverse=True) + [end_point]
        elif (lgt1 > lgt2): # to west
            if (lat1 < lat2): # to north
                s = sorted(track,key=itemgetter(0),reverse=True)
                ordered_track = [start_point] + sorted(s,key=itemgetter(1)) + [end_point]
            else: # to south
                ordered_track = [start_point] + sorted(track,key=itemgetter(1,0),reverse=True) + [end_point]
    return ordered_track
mobike_df['start_point'] = [(st_lgt,st_lat) for st_lgt,st_lat in zip(mobike_df.start_location_x,mobike_df.start_location_y)]
mobike_df['end_point'] = [(end_lgt,end_lat) for end_lgt,end_lat in zip(mobike_df.end_location_x,mobike_df.end_location_y)]
mobike_df2 = mobike_df.copy()
# 重排骑行轨迹
mobike_df2['new_trace'] = [reorder_track(st_point,ed_point,track) for st_point, ed_point, track in zip(mobike_df2.start_point,mobike_df2.end_point,mobike_df2.track)]
数据结构与概况
通过以上数据的评估与清理,得出:
- 该数据集的大部分变量的数据类型为数值型,如地理位置(起止点),骑行轨迹,骑行时长,骑行起止时间,其次订单编号、用户编号以及车辆编号为字符型;
- 该数据集因为骑行时长中存在少量的异常值,清理后的数据集在源数据集的基础上移除部分,约占源数据量的0.02%,对分析结果基本无影响。
数据探索概述
本次单车的数据探索中,主要想集中于对于单车在上海各个城区内使用量的地理位置分布、用户偏好以及用户价值这三方面进行探索,需要探索的主要度量为订单数量、骑行时长、地理位置,实现的方法如下:
采用5W和RFM的分析方法进行探索性分析,并以可视化方式对结果进行呈现:
-
5W (可以对用户的行为以及地理位置的分布进行分析)
-
WHAT
- 车辆的重复使用率如何?
-
WHEN
- 随着时间的推移,订单量/骑行时长是如何发展的?
- 一周内,不同日期的订单数/骑行时长是如何分布的?
- 一天内是否有明显的骑行高低峰期,订单量和骑行时长是如何变化的,是否有差异?
-
WHERE
- 哪些地点是车辆使用的高频地段?
- 哪些地点是骑车轨迹经常经过的?
- 哪些路线是骑车较热的路线?
- 哪些地点的车辆重复使用率较高?
-
Who
- 用户的重复使用率
-
-
RFM(对用户价值进行分析)
- R:最近一次使用单车的日期
- F:骑行的总体频率
- M:骑行的总时长
单变量分析
# 计算车辆的重复使用率
bike_reuse_ratio = sum(mobike_df2.bikeid.value_counts() >= 2)/mobike_df2.bikeid.value_counts().size
bike_reuse_ratio
0.21356777558357384
# 计算用户的重复使用率
user_reuse_ratio = sum(mobike_df2.userid.value_counts() >= 2)/mobike_df2.userid.value_counts().size
user_reuse_ratio
0.9292229329542763
车辆的重复使用率比较低,而用户的重复使用率很高,高达92.9%
# 探索筛选后的骑行时长的数据分布,先以正常的scale探索
plt.figure(figsize=(8,6))
colorful = sns.color_palette('Paired')
plt.hist(data=mobike_df2,x='riding_time',color=colorful[2])
plt.xlabel('Riding_Time(m)')
plt.ylabel('Frequency');
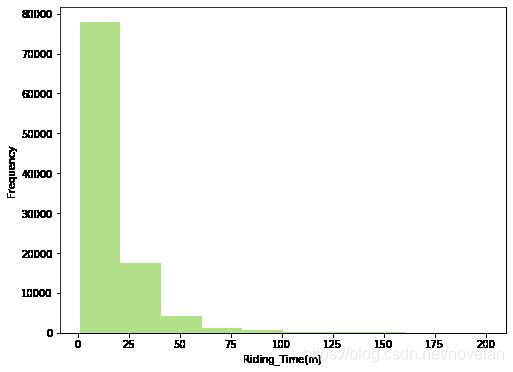
# 数据严重右偏,对riding_time轴进行对数变换
plt.figure(figsize=(8,6))
bin_edge = 10**np.arange(0,np.log10(mobike_df2.riding_time.max())+0.01,0.01)
plt.hist(data=mobike_df2,x='riding_time',bins=bin_edge,color=colorful[2])
plt.xscale('log')
plt.xticks(ticks=[1,3,5,10,30,50,70,100,150,200],labels=[1,3,5,10,30,50,70,100,150,200])
plt.xlabel('Riding_Time(m)')
plt.ylabel('Frequency');
# 探索日期时间上的数据分布,为了探索整个8月连续性发生的骑行发生的日期时间,将日期型数据转换成连续型的浮点型数值
from datetime import datetime
import time
datetime_value = [time.mktime(datetime(s_datetime.year,s_datetime.month,s_datetime.day,s_datetime.hour,s_datetime.minute,s_datetime.second).timetuple()) for s_datetime in mobike_df2.start_time]
bin_edge = np.arange(np.min(datetime_value),np.max(datetime_value)+10000,10000)
# 探索时间上的订单总量的数据分布
fig,axes = plt.subplots(figsize=(15,6))
colorful = sns.color_palette('Paired')
sns.distplot(datetime_value,bins=bin_edge,hist_kws={'color':colorful[2],'alpha':1},kde=False,ax=axes)
axes.set_xscale('log')
axes.set_xlabel('Datetime_Value(D)')
axes.set_ylabel('Frequency');
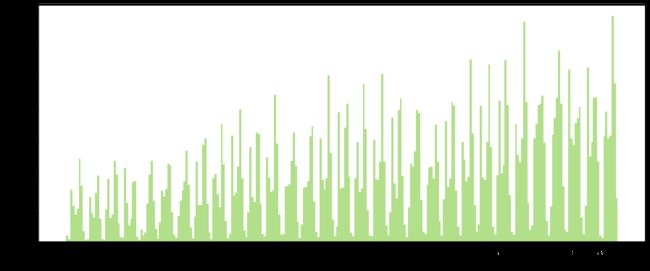
可以看出,在日期时间的分布上,订单数量呈波段式增长趋势,图中共有31个波段,所以每一个波段对应一天,而一天中也都基本呈现着双峰结构,推断对应着早晚高峰,而日期与日期之间则是夜间凌晨。
# 探索起点经度和维度的数据分布
fig,axes = plt.subplots(1,2,figsize=(16,6))
bin_edge1 = np.arange(mobike_df2.start_location_x.min(),mobike_df2.start_location_x.max()+0.005,0.005)
sns.distplot(mobike_df2.start_location_x,bins=bin_edge1,kde=False,hist_kws={'alpha':1,'color':colorful[2]},ax=axes[0])
bin_edge2 = np.arange(mobike_df2.start_location_y.min(),mobike_df2.start_location_y.max()+0.005,0.005)
sns.distplot(mobike_df2.start_location_y,bins=bin_edge2,kde=False,hist_kws={'alpha':1,'color':colorful[2]},ax=axes[1]);
# 探索起点经度和维度的数据分布
fig,axes = plt.subplots(1,2,figsize=(16,6))
bin_edge3 = np.arange(mobike_df2.end_location_x.min(),mobike_df2.end_location_x.max()+0.005,0.005)
sns.distplot(mobike_df2.end_location_x,bins=bin_edge3,kde=False,hist_kws={'alpha':1,'color':colorful[2]},ax=axes[0])
bin_edge4 = np.arange(mobike_df2.end_location_y.min(),mobike_df2.end_location_y.max()+0.005,0.005)
sns.distplot(mobike_df2.end_location_y,bins=bin_edge2,kde=False,hist_kws={'alpha':1,'color':colorful[2]},ax=axes[1]);
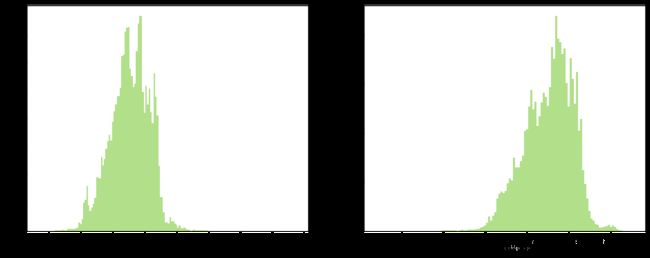
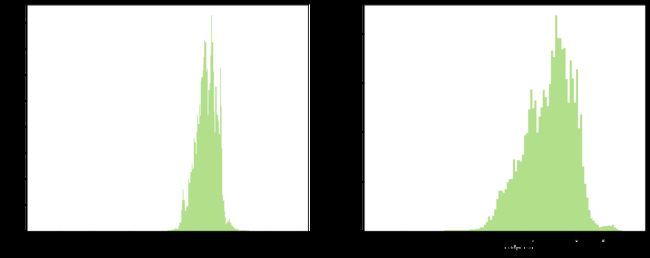
从终点的地理位置分布可以看出,经度主要集中于121.4-121.5,之间,整体左偏,维度主要集中于31.2-31.3.之间,整体左偏,存在少量驶向西南方向的路线。
整体上开看,起点和终点的聚集区域基本一致
双变量分析
# 为了更好地查看变量在日期上的变化,将日期时间按照day,hour,day_name进行分组,以便更好地多角度分析和论证
mobike_df2['day'] = mobike_df2.start_time.dt.day
mobike_df2['hour'] = mobike_df2.start_time.dt.hour
mobike_df2['day_name'] = mobike_df2.start_time.dt.day_name()
# 探索订单总量随着日期的推移的变化趋势
plt.figure(figsize=(15,6))
day_count = mobike_df2.start_time.dt.day.value_counts().sort_index()
plt.plot(day_count.index,day_count.values,marker='o',color=colorful[3])
plt.xticks(ticks=range(1,32,1),labels=range(1,32,1))
plt.xlabel('Day',fontsize=10)
plt.ylabel('Order_Count',fontsize=10);
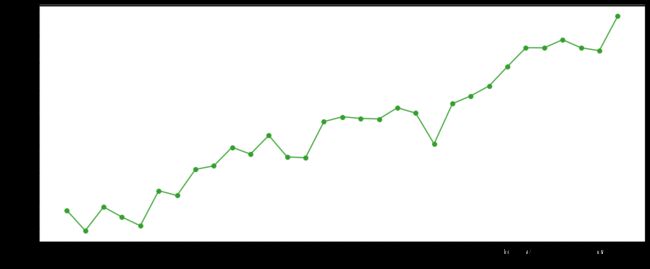
随着日期的增长,订单量呈增长趋势,且增速不断加快,此观察结果再次印证了订单数量随着日期时间的推移,整体呈上升趋势
cat_dtype = pd.api.types.CategoricalDtype(categories=['Monday', 'Tuesday','Wednesday','Thursday','Friday','Saturday','Sunday'],
                                          ordered=True)
mobike_df2.day_name = mobike_df2.day_name.astype(cat_dtype)
# 探索订单总量和订单平均是否对所属周日期存在偏好
fig,axes = plt.subplots(1,2,figsize=(12,6))
base_color = sns.color_palette()[0]
sns.countplot(data=mobike_df2,x='day_name',color=base_color,ax=axes[0])
axes[0].set_ylabel('Total_order_count')
group_day = mobike_df2.groupby(['day','day_name']).size().reset_index(name='order_count',level=1)
sns.barplot(data=group_day,x='day_name',y='order_count',color=base_color,ax=axes[1])
axes[1].set_ylabel('Avg_order_count')
fig.autofmt_xdate();
group_day.groupby('day_name').size().sort_values(ascending=False)
day_name
Wednesday    5
Tuesday      5
Monday       5
Sunday       4
Saturday     4
Friday       4
Thursday     4
dtype: int64
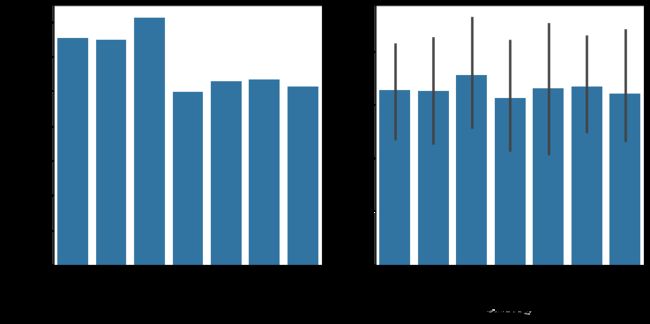
- 从周日期的数据分布上来看,Wednesday、Monday和Tuesday在总订单量上较大;就平均订单量,周日期的数据差异不大,分布相对均匀;
- 产生上述差异的原因是:8月的Wednesday、Monday和Tuesday比其他日期要多1天,所以在周日期的分布上,数据差异不大。
# 探索订单总量在一天内的不同时间段是否存在较大的数据差异,即是否存在高低峰期
plt.figure(figsize=(15,6))
hour_count = mobike_df2.start_time.dt.hour.value_counts().sort_index()
plt.plot(hour_count.index,hour_count.values,marker='o')
plt.xticks(ticks=range(0,24,1),labels=range(0,24,1))
plt.xlabel('Hour',fontsize=10)
plt.ylabel('Total_order_Count',fontsize=10);
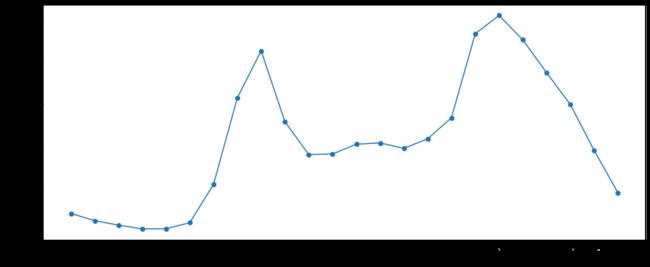
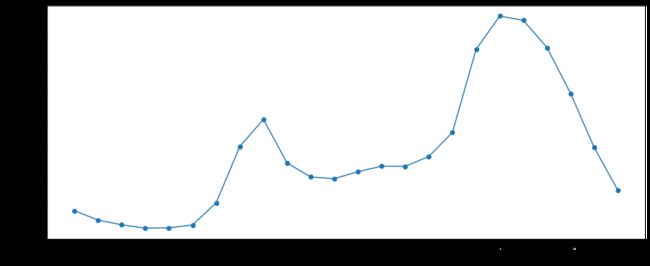
- 订单量在时间上的分布上呈现较大差异,由上图可知,存在较明显早晚高峰时段:7-9点骑行量较大,8点左右达到上午高峰值,17-20点骑行量较大,18点左右达到高峰,晚高峰的订单数量大于早高峰的订单数量,而夜间和凌晨(0-5)期间,订单数量达到低峰;
- 所以运营商应该在发生骑行次数较少的时段,如凌晨23-5点或者9-15点进行车辆的投放或维修,以备高峰时段有足够的质量良好的车辆供用户使用。
# 探索骑行总时长在日期上的分布
plt.figure(figsize=(15,6))
riding_time_total = mobike_df2.groupby('day')['riding_time'].sum()
plt.plot(riding_time_total.index,riding_time_total,marker='o');
plt.xticks(ticks=range(1,32,1),labels=range(1,32,1))
plt.xlabel('Day',fontsize=10)
plt.ylabel('total riding time(min)'.title(),fontsize=10);
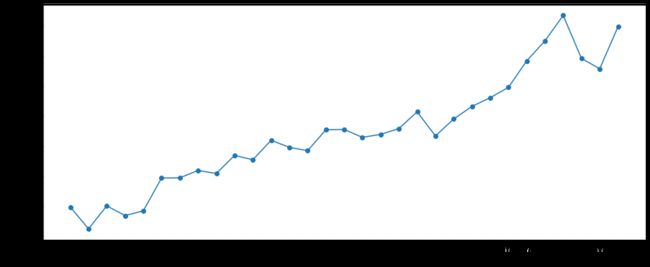
骑行总时长在日期上的分布与订单总量在日期上的分布基本一致,订单总量随着时间的推移不断增长的同时,骑行总时长也随之不断增长,且增速不断加快。
# 因为骑行总时长受订单量的影响,为了进一步探索,需要分析骑行平均时长在8月每一天的分布
plt.figure(figsize=(15,6))
riding_time_avg = mobike_df2.groupby('day')['riding_time'].mean()
riding_time_sem = mobike_df2.groupby('day')['riding_time'].sem()
plt.errorbar(x=riding_time_avg.index,y=riding_time_avg,yerr=riding_time_sem);
plt.xticks(ticks=range(1,32,1),labels=range(1,32,1))
plt.ylim(bottom=0)
plt.xlabel('Day',fontsize=10)
plt.ylabel('avg of riding time(min)'.title(),fontsize=10);
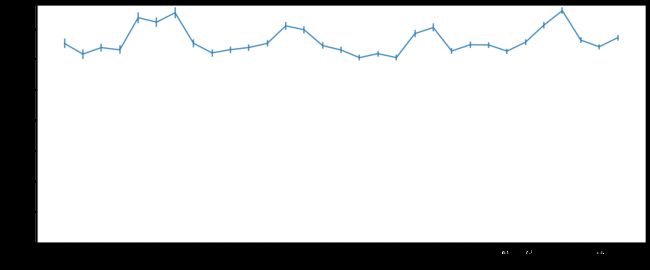
从平均骑行时长在日期上的数据分布上来看,周六和周日(工作日)比其他日期的平均时长略长
# 探索骑行总时长在一天内的每个时间段内的数据
plt.figure(figsize=(15,6))
hour_riding_time = mobike_df2.groupby('hour')['riding_time'].agg('sum')
plt.plot(hour_riding_time.index,hour_riding_time.values,marker='o')
plt.xticks(ticks=range(0,24,1),labels=range(0,24,1))
plt.xlabel('Hour',fontsize=10)
plt.ylabel('total riding time'.title(),fontsize=10);
- 从时间段与骑行总时长的数据分布上来看,分布形态基本与订单量在时间段上的分布一致,呈现显著的早晚高峰期;
- 但是骑行时长在早高峰和晚高峰上的差异比订单量在两个时间段上的差异更大
# 同样骑行总时长会受到订单量的影响,进而探索骑行的平均时长在各个时间段内的数据
plt.figure(figsize=(15,6))
riding_time_avg2 = mobike_df2.groupby('hour')['riding_time'].mean()
riding_time_sem2 = mobike_df2.groupby('hour')['riding_time'].sem()
plt.errorbar(x=riding_time_avg2.index,y=riding_time_avg2,yerr=riding_time_sem2);
plt.xticks(ticks=range(0,24,1),labels=range(0,24,1))
plt.ylim(bottom=0)
plt.xlabel('Hour',fontsize=10)
plt.ylabel('avg of riding time(min)'.title(),fontsize=10);
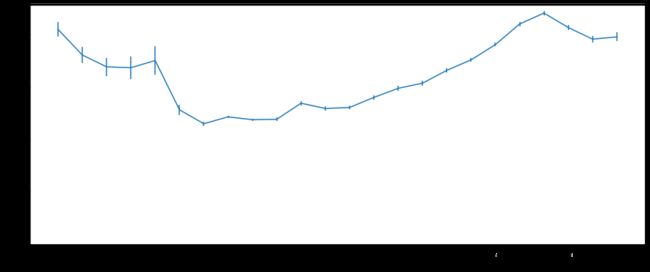
由上图可得:
- 上图可以解释早晚高峰时段在订单量差异不大的情况下,骑行总时长却存在很大差异的现象:晚上的平均骑行时长大于早上的平均骑行时长;
- 上图在0-5点期间,骑行时长相对于白天大部分时间段比较长,但是该期间的个体之间数据差异比较大,可能存在个别较大的异常值;
- 此现象说明用户在晚上,如下班后有更充裕的时间或者愿意花费更多的时间来骑车,而早上的时间相对比较紧张,即使是同等距离,也会比晚上花费的时间更少。
# 探索一周内的每天在其各个时间段的平均骑行时长
day_hour_time = mobike_df2.groupby(['day_name','hour'])['riding_time'].mean().reset_index(name='riding_time_avg')
day_hour_time_pivot = pd.pivot_table(data=day_hour_time,index='day_name',columns='hour',values='riding_time_avg')
plt.figure(figsize=(16,8))
sns.heatmap(data=day_hour_time_pivot,cmap='BuGn',cbar_kws={'label':'riding_time'});
有上图可知:
- 周六和周天有更充裕的时间来骑车,对比其他天,周六和周天在各个时间段上的平均骑行时长均有所增加;
- 在时间段的分布上,与以上的时间段与骑行时长的分布基本一致,晚上和夜间的骑行时长大于白天的骑行时长,而周六和周日在该特征上体现地更加显著。
基于地理位置的探索
# 经纬度结合,对完整的坐标点进行探索
plt.figure(figsize=(8,5))
bins_x = np.arange(121.17, 121.97+0.1, 0.01)
bins_y = np.arange(30.84, 31.45+0.1,0.01)
plt.hist2d(data=mobike_df2,x='start_location_x',y='start_location_y',bins = [bins_x, bins_y],cmap = 'viridis_r',cmin = 0.5);
plt.xlim((121.2,121.7))
plt.ylim((31.0,31.4))
plt.xlabel('start_point_lat')
plt.ylabel('start_point_lgt')
plt.colorbar();
plt.figure(figsize=(8,5))
bins_x = np.arange(121.17, 121.97+0.1, 0.01)
bins_y = np.arange(30.84, 31.45+0.1,0.01)
plt.hist2d(data=mobike_df2,x='end_location_x',y='end_location_y',bins = [bins_x, bins_y],cmap = 'viridis_r', cmin = 0.5);
plt.xlim((121.2,121.7))
plt.ylim((31.0,31.4))
plt.xlabel('end_point_lat')
plt.ylabel('end_point_lgt')
plt.colorbar();
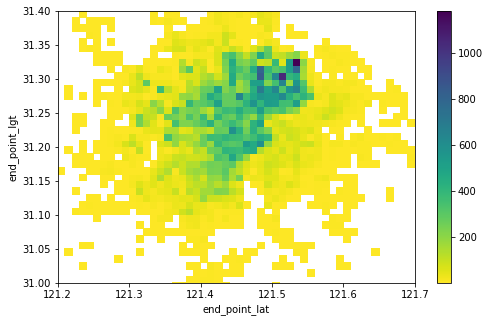
起点和终点集中区域基本一致,主要集中((121.4-121.55),(31.2-31.35))区域内
# 将地理位置数据标注至地图上
st_locs = mobike_df2[['start_location_y','start_location_x']].values.tolist()
# 所有起点标注到地图上,以热图形式显示
m = folium.Map(location=[31.22,121.48],control_scale=True, zoom_start=10)
m.add_child(plugins.HeatMap(st_locs,radius=7,gradient={.4: 'blue', .65: 'lime', 1: 'yellow'}))
m.save('st_loc_heatmap.html')
HTML('')
通过调用百度地图API,得出地理信息更为详细的热力图,详情请查看Mobike Data/Mobike_location_heatmap.html
由上图和html可知:
- 从覆盖区域上来看,骑车起止点,或者说车辆使用主要集中在虹口区、黄浦区、静安区,而离上海市中心较远的普陀区、长宁区、徐汇区和浦东新区车辆使用量相对较低,
- 城市特征上来看,车辆使用量较大的主要位于大学城区、体育馆、大型商圈、密集住宅区及主要交通干道交汇处(立交桥,交通枢纽)地段等:
- 如:以同济和复旦大学为代表的大学城区,江湾体育场,内环共和立交桥,中环虹桥枢纽等
- 黄浦区各个以中国城市命名的主要街道,人民广场
- 在地铁沿线上,如1号线,3号线,11号线和13号线是车辆高频使用沿线
#探索骑行轨迹
data = pd.DataFrame(mobike_df2.new_trace.tolist()).stack().reset_index().rename(columns={'level_0':'order','level_1':'trace_order',0:'location'})
data['lng'] = data.location.apply(lambda x:x[0])
data['lat'] = data.location.apply(lambda x:x[1])
# 提取出trace数据,在Tableau中绘制路径图
data.to_csv('./Mobike_trace.csv',index=False)
以下是使用Tableau绘制的关于单车骑行的轨迹图
Tableau Public-Mobike Trace Chart
通过轨迹图可以看出的是:
- 骑行主要是以短距离为主,长距离的轨迹点多的比较少
- 骑行的主要活动区域正如上述热力图所示,主要集中在中心城区,如虹口区、黄埔区、杨浦区
- 黄浦沿江区域的骑行轨迹较多
基于用户的探索
使用RFM模型探索和衡量各个用户的客户价值和创利能力
mobike_df2.head(2)
| orderid | bikeid | userid | start_time | start_location_x | start_location_y | end_time | end_location_x | end_location_y | track | riding_time | start_point | end_point | new_trace | day | hour | day_name | |
|---|---|---|---|---|---|---|---|---|---|---|---|---|---|---|---|---|---|
| 0 | 78387 | 158357 | 10080 | 2016-08-20 06:57:00 | 121.348 | 31.389 | 2016-08-20 07:04:00 | 121.357 | 31.388 | [(121.347, 31.392), (121.349, 31.39), (121.35,... | 7.0 | (121.348, 31.389) | (121.357, 31.388) | [(121.348, 31.389), (121.347, 31.392), (121.34... | 20 | 6 | Saturday |
| 1 | 891333 | 92776 | 6605 | 2016-08-29 19:09:00 | 121.508 | 31.279 | 2016-08-29 19:31:00 | 121.489 | 31.271 | [(121.489, 31.27), (121.49, 31.27), (121.49, 3... | 22.0 | (121.508, 31.279) | (121.489, 31.271) | [(121.508, 31.279), (121.507, 31.279), (121.50... | 29 | 19 | Monday |
# 假设当前日期是2016年9月1日
from datetime import datetime
mobike_df2['user_recently']  = (datetime(2016,9,1) - mobike_df2.start_time).dt.days
R =  mobike_df2.groupby('userid')['user_recently'].min()
M = mobike_df2.groupby('userid')['riding_time'].sum()
F = mobike_df2.userid.value_counts()
fig,axes = plt.subplots(1,3,figsize=(18,6))
sns.distplot(R,kde=False,hist_kws = {'alpha' : 1},ax=axes[0],color=colorful[2])
axes[0].set_xlabel('recent_day_diff')
sns.distplot(M,kde=False,hist_kws = {'alpha' : 1},ax=axes[1],color=colorful[2])
axes[1].set_xlabel('riding_time_total')
sns.distplot(F.values,kde=False,hist_kws = {'alpha' : 1},ax=axes[2],color=colorful[2])
axes[2].set_xlabel('order_count');
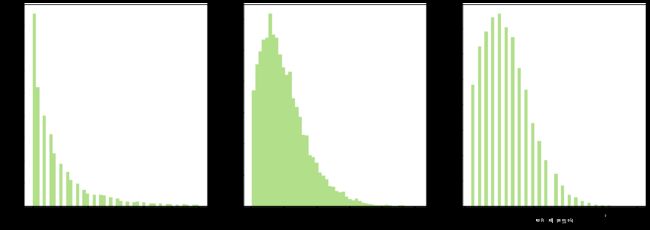
从上图可知:
- 因为该数据集仅为8月这一个月的单车订单数据,从上方recent_day_diff图可知,发生在最近的骑行占比较大,而且从上述订单量随着日期增长而不断增长的数据可知,随着摩拜单车的不断推广,新用户的数量在不断增长,且增速越来越大。
- 单个用户在8月的累计骑行时长集中在50-100分钟之间,单个用户在8月的累计骑行次数多集中在2-8次,少数用户有高达20次以上的使用
grouped_user = mobike_df2.groupby('userid')
# 对不同列使用不同的统计方法
user_rfm = grouped_user.agg({'user_recently':'min','riding_time':'sum','orderid':'count'})
user_rfm.rename(columns={'user_recently':'days_diff','riding_time':'riding_time_total','orderid':'order_count'},inplace=True)
根据上述三类特征数据的数据分布图,具体分箱出各个特征下的不同数值区间的对应分值(满分均为5分),如下所示:
| RFM | Data Bin | Grades |
|---|---|---|
| Recency | 0-5 | 5 |
| Recency | 6-11 | 4 |
| Recency | 12-17 | 3 |
| Recency | 18-23 | 2 |
| Recency | 24-30 | 1 |
| Frequency | >=15 | 5 |
| Frequency | 12-14 | 4 |
| Frequency | 10-11 | 3 |
| Frequency | 6-9 | 2 |
| Frequency | 0-5 | 1 |
| Monetary(riding time total) | >=300 | 5 |
| Monetary(riding time total) | 200-299 | 4 |
| Monetary(riding time total) | 100-199 | 3 |
| Monetary(riding time total) | 50-99 | 2 |
| Monetary(riding time total) | 0-49 | 1 |
user_rfm['r_grade'] = pd.cut(user_rfm.days_diff,bins=[0,6,12,18,24,31],labels=[5,4,3,2,1],right=False,include_lowest=True)
user_rfm['f_grade'] = pd.cut(user_rfm.order_count,bins=[0,6,10,12,15,26],labels=[1,2,3,4,5],right=False,include_lowest=True)
user_rfm['m_grade'] = pd.cut(user_rfm.riding_time_total,bins=[0,50,100,200,300,512],labels=[1,2,3,4,5],right=False,include_lowest=True)
user_rfm.r_grade = user_rfm.r_grade.astype(pd.api.types.CategoricalDtype(categories=[1,2,3,4,5],ordered=True))
user_rfm['r_value'] = user_rfm.r_grade.astype('int')
user_rfm['f_value'] = user_rfm.f_grade.astype('int')
user_rfm['m_value'] = user_rfm.m_grade.astype('int')
user_rfm.reset_index(inplace=True)
# 计算出三项的平均值
r_mean = user_rfm.r_value.mean()
f_mean = user_rfm.f_value.mean()
m_mean = user_rfm.m_value.mean()
r_mean,f_mean,m_mean
(4.596600331674958, 1.7670575692963753, 2.269426676143094)
将数据集的三项数据与三项平均值作对比,将客户价值按照下图所示划分

def get_custermer_value(r,f,m):
    if r > r_mean and f > f_mean and m > m_mean:
        user_tag = '重要价值客户'
    elif r < r_mean and f > f_mean and m > m_mean:
        user_tag = '重要唤回客户'
    elif r > r_mean and f < f_mean and m > m_mean:
        user_tag = '重要深耕客户'
    elif r < r_mean and f < f_mean and m > m_mean:
        user_tag = '重要挽留客户'
    elif r > r_mean and f > f_mean and m < m_mean:
        user_tag = '潜力客户'
    elif r > r_mean and f < f_mean and m < m_mean:
        user_tag = '新客户'
    elif r < r_mean and f > f_mean and m < m_mean:
        user_tag = '一般维持客户'
    elif r < r_mean and f < f_mean and m < m_mean:
        user_tag = '流失客户'
    return user_tag
user_rfm['user_value'] = user_rfm[['r_value','f_value','m_value']].apply(lambda x:get_custermer_value(x.r_value,x.f_value,x.m_value), axis = 1)
# 支持中文
plt.rcParams['font.sans-serif'] = ['Microsoft YaHei']  # 用来正常显示中文标签
plt.rcParams['axes.unicode_minus'] = False  # 用来正常显示负号
# 统计各类客户的占比
value_counts = user_rfm.user_value.value_counts()
fig,ax = plt.subplots(figsize=(8,8))
sns.barplot(x=value_counts.index,y=value_counts.values,color=colorful[2])
plt.xticks(rotation=30);
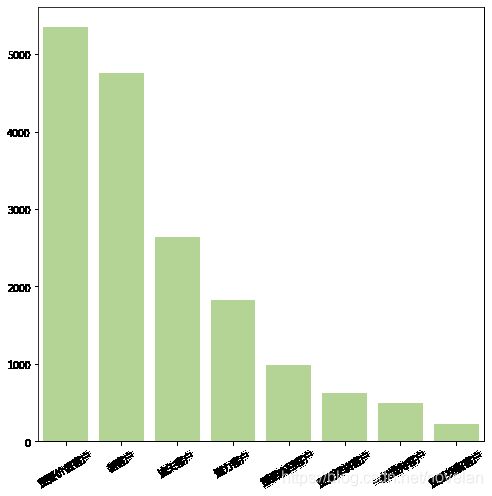
- 可以看出占比较大的分别是:重要价值客户、新客户,其中重要价值客户的占比最大,新客户占比略低一点,仅次于重要价值客户占比;
- 流失客户也存在一定的占比,公司需要对于流失率上进行进一步的分析,如用户体验,产品质量,竞争者数量,或者公共关系等原因;
结论
通过5W1H的分析方法与日期时间维度的结合,得出以下结论:
- 车辆的重复使用率为21.36%,而用户的重复使用率是92.92%。衣食住行中的行属于刚性需求,用户复用率之高反映了用户的需求量大之外,还反映了用户对于产品的初步认可或者竞争者数量较少等原因,而车辆的复用率之低可能是由于目前市场投放的车辆数量远大于需求量,从而造成供过于求的局面,也有可能产品破损严重,所以需要根据相关数据再作分析。
- 基于日期和时间维度的分析:
- 随着日期的推移,订单总量和骑行总时长呈快速增长趋势;
- 在一天内的时间变化中,订单总量呈现明显的早晚高峰时段:7-9点骑行量较大,8点左右达到上午高峰值,17-20点骑行量较大,18点达到一天的高峰值,所以运营商应该在非高峰时段,如凌晨23-5点或者10-15点进行车辆的投放或维修,以备高峰时段有足够的质量良好的车辆供用户使用;
- 骑行的总时长因为订单总量的影响,数据呈现与订单总量在时间维度的分布上基本一致,但从骑行的平均时长上来看,晚上(18点以后)用户的骑行时长大于白天,大致可以推断用户有更充裕的时间或者愿意花费更多的时间在晚上(如下班后)骑车,而上午的时间相对比较紧张;
- 从工作日和非工作日上来分析,周六周日的平均骑行时长大于工作日的平均骑行时长;
- 基于地理位置的分析:
- 从行政区划上来看,车辆使用主要集中在虹口区、黄浦区、静安区,而普陀区、长宁区、徐汇区和浦东新区车辆使用量相对较低;
- 从城市特征上来看,车辆使用主要集中在大学城区、体育馆、大型商圈、密集住宅区及主要交通干道交汇处(立交桥,交通枢纽)等地段;
- 以同济和复旦大学为代表的大学城区,江湾体育场,内环共和立交桥,中环虹桥枢纽等
- 黄浦区各个以中国城市命名的主要街道,人民广场
- 从地铁沿线上来看:1号线,3号线,11号线和13号线是车辆高频使用沿线;
- 从骑行轨迹上开看:
- 骑行主要是以短距离为主,长距离的轨迹点多的比较少;
- 骑行的主要活动区域正如上述热力图所示,主要集中在中心城区,如虹口区、黄埔区、杨浦区;
- 黄浦沿江区域的骑行轨迹较多;
通过RFM模型对用户价值进行了探索分析,得出以下结论:
- 基于用户的分析:
- 随着摩拜单车在市场的不断推广,新用户的数量呈现快速增长趋势;
- 大部分用户骑行时长在5-10分钟,单个用户在8月的累计骑行次数集中在3-7次,少数用户有高达20次以上的使用量;
- 重要价值客户、新客户、流失客户和潜力客户的占比较大,其中重要价值客户的占比最大,高达31.7%,新用户的占比仅次于重要价值客户的占比,也占据28.1%的用户,这一分析结果也再次论证,摩拜单车目前正处于上升期或者说快速扩张期,为了快速占领市场流量和提高公司的知名度,公司目前大量投放单车,新用户快速增长;
- 流失客户也存在较大的占比,在占比数据上排第三,公司需要对于流失率上进行进一步的分析,如用户体验,产品质量,竞争者数量,或者公共关系等原因。
- 当然重要价值客户的占比最高,所以在继续保持优势的基础上,可以根据不同的客户价值群体,采取相应的运营措施:如推送折扣月卡,不定期发送免费骑车券,与其他公司合作,可以使用骑行里程兑换礼品等;
