计算机视觉-计算机视觉开源库OpenCV基础
1、加载、显示、保存图像
import argparse
import cv2

ap = argparse.ArgumentParser()
ap.add_argument("-i", "--image", required=True, help="Path to the image")#读取指定指令,获取图片。参数1:输入指令的头字母,参数2:需要输入的指令
args = vars(ap.parse_args())

image = cv2.imread(args["image"]) #读取指定参数的,读取照片
print "width: %d pixels" % (image.shape[1])  # 获取图像的宽度,横向尺寸,图像坐标系中,第二个参数
print "height: %d pixels" % (image.shape[0] )#获取图像的高度,竖向尺寸,图像坐标系中,第一个参数 注意:读取图像x,y互换
print "channels: %d" % (image.shape[2])

cv2.imshow("Image", image)#显示图片
cv2.imwrite("newimage.jpg", image) #将图片写入指定路径
cv2.waitKey(0)#等待程序结束
2、图像基础
(h, w) = image.shape[:2] #(x,y)像素中的显示,获取图片的高度(x),获取图片的宽度(y)

(b, g, r) = image[0, 0] #获取指定位置的像素,存储方式为bgr

(cX, cY) = (w / 2, h / 2) #cX:图片的宽度,cY:图片高度
tl = image[0:cY, 0:cX] #获取图片的左上角部分[起始点x坐标:终点x坐标,起点的y坐标:终点y坐标],得出的值分别指高度和宽度


#运用像素指定位置赋值方法,向Background图片上插入图片resized_left

for left_x in xrange(0, 500, 1):
  for left_y in xrange(0, 500, 1):
    Background[400 + left_x, 20 + left_y] = resized_left[left_x, left_y]
3、绘图
canvas = np.zeros((300, 300, 3), dtype="uint8") #设置画布尺寸

green = (0, 255, 0)#设置线条颜色
cv2.line(canvas, (0, 0), (300, 300), green) #参数1:指定画布,参数2:线条的开始位置,参数3:线条终点位置,参数4:线条颜色
cv2.line(canvas, (300, 0), (0, 300), red, 3) #参数5:线条像素厚度

cv2.rectangle(canvas, (10, 10), (60, 60), green)#参数1:指定画布,参数2:矩形起点位置,参数3:矩形对角线点的位置,线条颜色
cv2.rectangle(canvas, (50, 200), (200, 225), red, 5)#参数5:线条宽度,负数表示填充矩形

(centerX, centerY) = (canvas.shape[1] / 2, canvas.shape[0] / 2)#设置圆心坐标
white = (255, 255, 255)#设置圆的线条颜色

cv2.circle(canvas, (centerX, centerY), r, white)#参数1:画布,参数2:圆心点,参数3:设置圆的半径,设置画圆的线条颜色

cv2.circle(canvas, tuple(pt), radius, color, -1)#参数4:设置画圆的线条粗细,如果为负数,表示填充圆
4、图像处理
4.1、翻译
M = np.float32([[1, 0, -50], [0, 1, -90]]) #定义翻译矩阵 :参数1:[1,0,x]:x表示像素向左或者向右移动个数,x为负值图像左移,正值为右移定。参数2:[0,1,y]:y表示像素上下移动,y为负值向上移动,正值向下移动。记忆口诀:前左负右正,后上负下正
shifted = cv2.warpAffine(image, M, (image.shape[1],image.shape[0]))#对矩阵进行翻译 参数1:翻译的目标图像,参数2:翻译的矩阵,参数3:翻译后图像大小

#imutils模块的翻译函数
shifted = imutils.translate(image, 0, 100)#参数1:移动的目标图像,参数2:左右移动的值,参数3:上下移动的值
注:不会改变图像大小。
4.2、旋转
注:运用翻译将图片移到中心位置,四周留出黑色边框,在运用旋转(旋转角度为0),可将图片放大
(h, w) = image.shape[:2] #获取图像的高和宽
(cX, cY) = (w / 2, h / 2) #获取图像的中心点

M = cv2.getRotationMatrix2D((cX, cY), 45, 1.0) #设置旋转矩阵,参数1:旋转点 参数2:旋转角度,正值逆时针旋转,负值顺时针选装,参数3:旋转后图像与原始图像的比例,图像原始大小不会发生变化,类似相机焦距变化
rotated = cv2.warpAffine(image, M, (w, h)) #参数1:目标图像,参数2:旋转矩阵,参数3#旋转后的图像尺寸

#imutils模块的旋转函数
rotated = imutils.rotate(image, 180) #参数1:旋转目标图片 参数2:旋转角度   center=(x,y)可以设置旋转点
4.3、图像大小调整
注:改变原始图片的实际大小
r = 150.0 / image.shape[1] #新图像与旧图像的宽比例 注:方便图片按原比例缩放
dim = (150, int(image.shape[0] * r)) #设置新图像的像素尺寸
resized = cv2.resize(image, dim, interpolation=cv2.INTER_AREA) #调整图像大小,返回一个新图像

#运用imutils中的resize函数
resized = imutils.resize(image, width=100) #参数1:目标图像,参数2:设置新图像的宽度,可以为height,运用高度

#运用插值方法缩放大图片,,通过不同的像素填充方法放大图片。
resized = imutils.resize(image, width=image.shape[1] * 3, inter=method)#参数1:目标图片,参数2:处理后图片像素宽(整形),参数3:像素处理方法
"""method: cv2.INTER_NEAREST:最近邻内插值
               cv2.INTER_LINEAR:双线性插值
               cv2.INTER_AREA:区域插值
               cv2.INTER_CUBIC:双三次插值
               cv2.INTER_LANCZOS4 :双三次插值
4.4、图像翻转
flipped = cv2.flip(image, 1)#水平翻转
flipped = cv2.flip(image, 0)#上下翻转
flipped = cv2.flip(image, -1)#水平翻转后上下翻转
4.5、图像裁剪
face = image[85:250, 85:220] #参数1:裁切高度 x开始位置:x结束位置,参数2:裁切宽度 y开始位置:y结束位置,返回新图片
4.6、图像像素像素值操作
注:修改图片的亮度
M = np.ones(image.shape, dtype = "uint8") * 100 #设置与图片大下相同的矩阵,矩阵填充值为100
added = cv2.add(image, M)#将原始图片与新矩阵相加,像素亮度提高100

M = np.ones(image.shape, dtype = "uint8") * 50#设置与图片大下相同的矩阵,矩阵填充值为50
subtracted = cv2.subtract(image, M)#将原始图片与新矩阵相减,像素亮度降低50
4.7、按位操作
注:主要是黑白图像处理
bitwiseAnd = cv2.bitwise_and(rectangle, circle)#当且仅当俩个相同位置的像素大于0,才返回真
bitwiseOr = cv2.bitwise_or(rectangle, circle)#俩个相同位置的像素有一个大于0,返回真
bitwiseXor = cv2.bitwise_xor(rectangle, circle)#当且仅当俩个相同位置的像素只有一个大于0,才返回真
bitwiseNot = cv2.bitwise_not(circle)#像素值取反
4.8、掩蔽
注:提取图像中感兴趣的部分,遮掩的必须用关键字mask
mask = np.zeros(image.shape[:2], dtype="uint8") #设置掩蔽画布的大小
cv2.rectangle(mask, (0, 90), (290, 450), 255, -1)#设置不掩蔽的地方
masked = cv2.bitwise_and(image, image, mask=mask)#图片显示的区域
4.9、像素分割与合并
(B, G, R) = cv2.split(image) #像素分离图像,B,G,R图像的值为整数,非BGR像素矩阵组成,其值是如何转变的?

merged = cv2.merge([B, G, R]) #三个色彩合并,还原为彩色图像,像素由BGR像素矩阵组成

zeros = np.zeros(image.shape[:2], dtype = "uint8")#建立一个二值画布,与各个色彩通道合并,像是各个色彩通道的影响
cv2.imshow("Red", cv2.merge([zeros, zeros, R]))#只有红色的图片
cv2.imshow("Green", cv2.merge([zeros, G, zeros]))#只有绿色的图片
cv2.imshow("Blue", cv2.merge([B, zeros, zeros]))#只有蓝色的图片
问:如何从BGR转换成整数值
5、内核
略
6、形态操作
image = cv2.imread(args["image"]) #打开一张图片
gray = cv2.cvtColor(image, cv2.COLOR_BGR2GRAY)#将图片转为二值划

#侵蚀 将前景物体变小,理解成将图像断开裂缝变大(在图片上画上黑色印记,印记越来越大)
for i in xrange(0, 3):
    eroded = cv2.erode(gray.copy(), None, iterations=i + 1)#参数1:需要侵蚀的图像,参数2:结构元素() 参数3:迭代次数,值越大,侵蚀越严重
    cv2.imshow("Eroded {} times".format(i + 1), eroded)
    cv2.waitKey(0)

#扩张 将前景物体变大,理解成将图像断开裂缝变小(在图片上画上黑色印记,印记越来越小)
for i in xrange(0, 3):
    dilated = cv2.dilate(gray.copy(), None, iterations=i + 1)#参数1:需要侵蚀的图像,参数2:结构元素() 参数3:迭代次数,值越大,扩张越大
    cv2.imshow("Dilated {} times".format(i + 1), dilated)
    cv2.waitKey(0)

#开盘 应用侵蚀以去除小斑点,然后应用扩张以重新生成原始对象的大小,用于消除杂质
kernelSizes = [(3, 3), (5, 5), (7, 7)]#定义结构化元素的宽度和高度

for kernelSize in kernelSizes:
    kernel = cv2.getStructuringElement(cv2.MORPH_RECT, kernelSize) #参数1:结构化元素的类型 参数2:构造元素的大小
    opening = cv2.morphologyEx(gray, cv2.MORPH_OPEN, kernel)#参数1:形态学运算的图像 参数2:形态操作的实际  类型 参数3:内核/结构化元素
    cv2.imshow("Opening: ({}, {})".format(kernelSize[0], kernelSize[1]), opening)
    cv2.waitKey(0)

"""形态操作实际类型:
    cv2.MORPH_CLOSE(闭幕):用于封闭对象内的孔或将组件连接在一起
    cv2.MORPH_GRADIENT(形态梯度):用于确定图像的特定对象的轮廓
"""
#顶帽/黑帽 显示黑色背景上的图像的  明亮区域。适合于灰度图像
rectKernel = cv2.getStructuringElement(cv2.MORPH_RECT, (13, 5))#定义宽度为13 像素和高度为  5像素的  矩形 结构元素
blackhat = cv2.morphologyEx(gray, cv2.MORPH_BLACKHAT, rectKernel)#参数1:形态学运算的图像 参数2:形态操作的实际  类型 参数3:内核/结构化元素

tophat = cv2.morphologyEx(gray, cv2.MORPH_TOPHAT, rectKernel) #参数1:形态学运算的图像 参数2:形态操作的实际  类型 参数3:内核/结构化元素
7、平滑和模糊
kernelSizes = [(3, 3), (9, 9), (15, 15)] #定义内核大小参数列表,内核越大,模糊越明显

# loop over the kernel sizes and apply an "average" blur to the image
for (kX, kY) in kernelSizes:
    blurred = cv2.blur(image, (kX, kY))#使用平均模糊方法,参数1:模糊对象,参数2:矩阵大小
    cv2.imshow("Average ({}, {})".format(kX, kY), blurred)
    cv2.waitKey(0)
"""模糊方法:
                平均模糊:过度模糊图像并忽略重要的边缘
                 blurred =cv2.blur(image, (kX, kY))
                高斯:保留更多的图像边缘
                 blurred =cv2.GaussianBlur(image, (kX, kY), 0)参数1:模糊对象,参数2:矩阵大小 参数3:标准方差
                中位数模糊:  图像中去除盐和胡椒,图像中的杂质点
                blurred = cv2.medianBlur(image, k)参数1:模糊对象,参数2:中位数值,为整型数据,数据越大图像越模糊
                双边模糊: 减少噪音同时仍然保持边缘,我们可以使用双边模糊。双边模糊通过引入两个高斯分布来实现
               blurred =cv2.bilateralFilter(image, diameter, sigmaColor, sigmaSpace)参数1:想要模糊的图像。参数2:像素邻域的直径 - 这个直径越大,模糊计算中包含的像素越多。参数3:颜色标准差,模糊时将考虑邻域中的更多颜色,相似颜色的像素才能显
               着地影响模糊,参数4:空间标准偏差,更大的值意味着像素越远离中心像素直径  将影响模糊计算。后面3个参数都为整型参数
"""
8、照明和色彩空间
#RGB 红、黄、蓝组成的颜色矩阵,每个色度值范围[0,255]
image = cv2.imread(args["image"])
for (name, chan) in zip(("B", "G", "R"), cv2.split(image)):
    cv2.imshow(name, chan)

#HSV 色调(H):们正在研究哪种“纯”的颜色。饱和度(S):颜色如何“白,例如纯红,随着零饱和度的颜色是纯白色。价值(V):该值允许我们控制我们的颜色的亮度,零值表示纯黑色
hsv = cv2.cvtColor(image, cv2.COLOR_BGR2HSV)
for (name, chan) in zip(("H", "S", "V"), cv2.split(hsv)):
    cv2.imshow(name, chan)

#L * a * b *表  L通道:像素的“亮度”。a通道:源于L通道的中心,在频谱的一端定义纯绿色,另一端定义纯红色。b通道:  也来自于L通道的中心,但是垂直于a通道。
lab = cv2.cvtColor(image, cv2.COLOR_BGR2LAB)
for (name, chan) in zip(("L*", "a*", "b*"), cv2.split(lab)):
    cv2.imshow(name, chan)

#灰度:转换成灰度级时,每个RGB通道  不是 均匀加权
gray = cv2.cvtColor(image, cv2.COLOR_BGR2GRAY)
9、阀值
阀值:图像的二值化
image = cv2.imread(args["image"])
gray = cv2.cvtColor(image, cv2.COLOR_BGR2GRAY)#将图像二值化
blurred = cv2.GaussianBlur(gray, (7, 7), 0)

(T,threshInv)=cv2.threshold(blurred,200,255,cv2.THRESH_BINARY_INV) #参数1:希望阈值的灰度图像。参数2:手动提供我们的T阈值。参数3:设置输出值。参数4:阈值方法(白色背景,黑色图),将像素值小于参数2的值换成参数3输出,大于参数2的值,输出值为0
cv2.imshow("Threshold Binary Inverse", threshInv)


(T, thresh) =cv2.threshold(blurred,200,255,cv2.THRESH_BINARY)#参数1:希望阈值的灰度图像。参数2:手动提供我们的T阈值。参数3:设置输出值。参数4:阈值方法(黑背景,白色图),将像素值大于参数2的值换成参数3输出,小于参数2的值,输出值为0。
cv2.imshow("Threshold Binary", thresh)

cv2.imshow("Output", cv2.bitwise_and(image, image, mask=threshInv))

#大津方法 参数1:希望阈值的灰度图像。参数2:大津的方法将自动计算出我们的T的最优值。参数3:阈值的输出值,只要给定像素通过阈值测试。参数4:对应于Otsu的阈值法
(T, threshInv) = cv2.threshold(blurred, 0, 255,cv2.THRESH_BINARY_INV | cv2.THRESH_OTSU)

#自适应阀值法:参数1:希望阈值的灰度图像。参数2:参数是输出阈值。参数3:自适应阈值法。参数4:阈值方法。参数5:是我们的像素邻域大小。参数6:微调  我们的阈值
thresh=cv2.adaptiveThreshold(blurred,255,cv2.ADAPTIVE_THRESH_MEAN_C, cv2.THRESH_BINARY_INV, 25, 15)
thresh =threshold_adaptive(blurred,29,offset=5).astype("uint8")* 255
thresh = cv2.bitwise_not(thresh)#阈值适配函数执行自适应阈值
10.1、图像渐变
图像渐变:图像梯度主要应用与边缘检测
#Sobel内核
gray = cv2.cvtColor(image, cv2.COLOR_BGR2GRAY)

gX = cv2.Sobel(gray, ddepth=cv2.CV_64F, dx=1, dy=0) #计算x方向的梯度
gY = cv2.Sobel(gray, ddepth=cv2.CV_64F, dx=0, dy=1) #计算y方向的梯度

gX = cv2.convertScaleAbs(gX) #转换回8位无符号整型
gY = cv2.convertScaleAbs(gY) #转换回8位无符号整型

sobelCombined = cv2.addWeighted(gX, 0.5, gY, 0.5, 0) #将俩个图像组合成单个图像


gX = cv2.Sobel(gray, cv2.CV_64F, 1, 0) #计算x梯度方向
gY = cv2.Sobel(gray, cv2.CV_64F, 0, 1) #计算y梯度方向

mag = np.sqrt((gX ** 2) + (gY ** 2)) #梯度幅度计算:平方梯度的平方根  X和  ÿ 相加
orientation = np.arctan2(gY, gX) * (180 / np.pi) % 180 #梯度方向计算:两个梯度的反正切

idxs = np.where(orientation >= args["lower_angle"], orientation, -1)#手柄选择,参数1: 函数是我们要测试的条件,寻找大于最小提供角度的索引。参数2:要检查的阵列在哪里。参数3:特定值设置为-1。
idxs = np.where(orientation <= args["upper_angle"], idxs, -1)
mask = np.zeros(gray.shape, dtype="uint8")#构造一个 掩码 - 所有具有相应idxs   值> -1的坐标 都设置为  255  (即前景)。否则,它们保留为  0(即背景)
mask[idxs > -1] = 255
10.2、边缘检测
边缘类型:
步边:阶跃边缘形式当存在来自不连续到另一的一侧的像素强度的突然变化
斜坡边缘:斜坡边缘就像一个阶跃边缘,仅在像素强度的变化不是瞬时的。相反,像素值的变化发生短而有限的距离
岭边:脊边缘是相似于两个结合 斜坡边缘,一个右对另一碰撞
屋顶边:顶部有一个短而有限的高原的边缘不同
边缘检测法:
- 对图像应用高斯平滑来帮助减少噪点。
- 使用Sobel内核计算
 和
和 图像渐变。
图像渐变。 - 应用非最大值抑制来仅保持指向梯度方向的梯度幅度像素的局部最大值。
- 定义和应用
 和
和 阈值滞后阈值
 gray = cv2.cvtColor(image, cv2.COLOR_BGR2GRAY) blurred = cv2.GaussianBlur(gray, (5, 5), 0) wide = cv2.Canny(blurred, 10, 200)#参数1:想要检测边缘的图像。参数2和3:分别提供阈值下限和阈值上限 #自动调整边缘检测参数 #自动调整边缘检测参数函数 def auto_canny(image, sigma=0.33): v = np.median(image) lower = int(max(0, (1.0 - sigma) * v)) upper = int(min(255, (1.0 + sigma) * v)) edged = cv2.Canny(image, lower, upper) return edged #自动调整边缘检测参数函数运用 blurred = cv2.GaussianBlur(gray, (3, 3), 0) auto = imutils.auto_canny(blurred)
11.1、查找和绘制轮廓
gray = cv2.cvtColor(image, cv2.COLOR_BGR2GRAY)

(cnts, _) = cv2.findContours(gray.copy(), cv2.RETR_LIST, cv2.CHAIN_APPROX_SIMPLE)#参数1:需要绘制轮廓的图像。参数2:返回的轮廓数量的标志。参数3:轮廓压缩类型。返回值:第一个值是轮廓本上。第二个值是要检查的轮廓层次结构
clone = image.copy()
cv2.drawContours(clone, cnts, -1, (0, 255, 0), 2)#参数1:要绘制轮廓的图像。参数2:使用的轮廓列表。参数3:cnts列表中的轮廓索引,-1表示绘制所有轮廓,0是仅画第一个,1表示绘制第二个轮廓。参数3:绘制轮廓的颜色。参数4:绘制轮廓线的像素

#轮廓单个绘制
for (i, c) in enumerate(cnts):
    print "Drawing contour #{}".format(i + 1)
    cv2.drawContours(clone, [c], -1, (0, 255, 0), 2)
    cv2.imshow("Single Contour", clone)
    cv2.waitKey(0)

#返回所有轮廓外观:
(cnts, _) = cv2.findContours(gray.copy(), cv2.RETR_EXTERNAL, cv2.CHAIN_APPROX_SIMPLE)

#轮廓外观与掩码的一起使用
for c in cnts:
    # construct a mask by drawing only the current contour
    mask = np.zeros(gray.shape, dtype="uint8")
    cv2.drawContours(mask, [c], -1, 255, -1)

    # show the images
    cv2.imshow("Image", image)
    cv2.imshow("Mask", mask)
    cv2.imshow("Image + Mask", cv2.bitwise_and(image, image, mask=mask))

#补充:运用霍夫找圆心
gray=cv2.cvtColor(img,cv2.COLOR_BGR2GRAY)
#输出图像大小,方便根据图像大小调节minRadius和maxRadius
print(img.shape)
#霍夫变换圆检测
circles= cv2.HoughCircles(gray,cv2.HOUGH_GRADIENT,1,100,param1=100,param2=30,minRadius=5,maxRadius=300)
#输出返回值,方便查看类型
print(circles)
#输出检测到圆的个数
print(len(circles[0]))
#根据检测到圆的信息,画出每一个圆
for circle in circles[0]:
    #圆的基本信息
    print(circle[2])
    #坐标行列
    x=int(circle[0])
    y=int(circle[1])
    #半径
    r=int(circle[2])
    #在原图用指定颜色标记出圆的位置
    img=cv2.circle(img,(x,y),r,(0,0,255),-1)
#显示新图像
cv2.imshow('res',img)
11.2、简单的轮廓属性
质心:质心”或“质心” 是图像中物体的中心 (x,y)坐标
#绘制轮廓质心
(cnts, _) = cv2.findContours(gray.copy(), cv2.RETR_EXTERNAL, cv2.CHAIN_APPROX_SIMPLE)
clone = image.copy()

for c in cnts:
    # compute the moments of the contour which can be used to compute the
    # centroid or "center of mass" of the region
    M = cv2.moments(c)
    cX = int(M["m10"] / M["m00"])
    cY = int(M["m01"] / M["m00"])

    # draw the center of the contour on the image
    cv2.circle(clone, (cX, cY), 10, (0, 255, 0), -1)
面积和周长:轮廓的面积是轮廓轮廓内部的像素数。类似地, 周长 (有时称为 弧长)是轮廓的长度
#获取轮廓的面积与周长
for (i, c) in enumerate(cnts):
    area = cv2.contourArea(c)
    perimeter = cv2.arcLength(c, True)
    print "Contour #%d -- area: %.2f, perimeter: %.2f" % (i + 1, area, perimeter)

    cv2.drawContours(clone, [c], -1, (0, 255, 0), 2)

#计算图像的质心,并在图像上显示轮廓数,以便我们可以将形状与终端输出相关联。
    M = cv2.moments(c)
    cX = int(M["m10"] / M["m00"])#?
    cY = int(M["m01"] / M["m00"])#?
    cv2.putText(clone, "#%d" % (i + 1), (cX - 20, cY), cv2.FONT_HERSHEY_SIMPLEX,
        1.25, (255, 255, 255), 4)
边框:边界”和“包含”整个图像的轮廓区域
for c in cnts:
    # fit a bounding box to the contour
    (x, y, w, h) = cv2.boundingRect(c)
    cv2.rectangle(clone, (x, y), (x + w, y + h), (0, 255, 0), 2)
旋转边框:
#绘制轮廓的旋转边框
for c in cnts:
    # fit a rotated bounding box to the contour and draw a rotated bounding box
    box = cv2.minAreaRect(c)#参数:我们的轮廓。并返回一个包含3个值的元组。元组的第一个值是旋转的边界框的起始  (x,y)坐标。第二个值是边界框的宽度和高度。而最终的值就是我们形状或旋转的角度
    box = np.int0(cv2.cv.BoxPoints(box))#宽度和高度以及旋转角转换为一组坐标点
    cv2.drawContours(clone, [box], -1, (0, 255, 0), 2)
最小封闭圆:
for c in cnts:
    ((x, y), radius) = cv2.minEnclosingCircle(c)#返回圆的中心的(x,y)坐标以及圆的  半径
    cv2.circle(clone, (int(x), int(y)), int(radius), (0, 255, 0), 2)
装配椭圆:将椭圆拟合到轮廓上很像将轮廓的矩形装配到轮廓上
for c in cnts:
    if len(c) >= 5:
        ellipse = cv2.fitEllipse(c)
        cv2.ellipse(clone, ellipse, (0, 255, 0), 2)
11.3、高级轮廓
长宽比:宽高比=图像宽度/图像宽度
程度:边界框区域=边界框宽度X边框高度
凸海鸥:欧氏空间中的一组 X点,凸包是包含这些X点的最小可能凸集
密实度:坚固度=轮廓面积/凸包面积
#识别‘X’与‘O’
(cnts, _) = cv2.findContours(gray.copy(), cv2.RETR_EXTERNAL, cv2.CHAIN_APPROX_SIMPLE)#获取轮廓列表

for (i, c) in enumerate(cnts):
    area = cv2.contourArea(c)#获取轮廓面积
    (x, y, w, h) = cv2.boundingRect(c)#获取轮廓的起始坐标,边界的宽度和高度
    hull = cv2.convexHull(c) #获取形状的实际凸包
    hullArea = cv2.contourArea(hull)#计算凸包面积
    solidity = area / float(hullArea)#获取坚固度

    char = "?"
 #依据坚固度,判断图像的形状
    if solidity > 0.9:
        char = "O"

    elif solidity > 0.5:
        char = "X"

#绘制轮廓
    if char != "?":
        cv2.drawContours(image, [c], -1, (0, 255, 0), 3)
        cv2.putText(image, char, (x, y - 10), cv2.FONT_HERSHEY_SIMPLEX, 1.25,
            (0, 255, 0), 4)

    print "%s (Contour #%d) -- solidity=%.2f" % (char, i + 1, solidity)

cv2.imshow("Output", image)
cv2.waitKey(0)
#识别俄罗斯方块
(cnts, _) = cv2.findContours(thresh.copy(), cv2.RETR_EXTERNAL, cv2.CHAIN_APPROX_SIMPLE)#获取图片中的轮廓列表
hullImage = np.zeros(gray.shape[:2], dtype="uint8")

for (i, c) in enumerate(cnts):
    area = cv2.contourArea(c)#获取轮廓面积
    (x, y, w, h) = cv2.boundingRect(c)#获取轮廓边界

    aspectRatio = w / float(h)#获取宽高比

    extent = area / float(w * h)#获取当前轮廓的范围

    hull = cv2.convexHull(c)
    hullArea = cv2.contourArea(hull)#
    solidity = area / float(hullArea)#获取坚固度,依据坚固度,判断物体形状

    cv2.drawContours(hullImage, [hull], -1, 255, -1)
    cv2.drawContours(image, [c], -1, (240, 0, 159), 3)
    shape = ""
11.4、轮廓近似
轮廓逼近:一种用减少的点集合减少曲线中的点数的算法,简单的称为分裂合并算法
#检测图像中的正方形
import cv2

image = cv2.imread("images/circles_and_squares.png")
gray = cv2.cvtColor(image, cv2.COLOR_BGR2GRAY)

#获得图像轮廓列表
(cnts, _) = cv2.findContours(gray.copy(), cv2.RETR_EXTERNAL, cv2.CHAIN_APPROX_SIMPLE)

#循环每个轮廓
for c in cnts:
        #获取轮廓的周长
    peri = cv2.arcLength(c, True)

    approx = cv2.approxPolyDP(c, 0.01 * peri, True)

    if len(approx) == 4:#判断处理后的轮廓是否有4个顶点
        # draw the outline of the contour and draw the text on the image
        cv2.drawContours(image, [c], -1, (0, 255, 255), 2)
        (x, y, w, h) = cv2.boundingRect(approx)
        cv2.putText(image, "Rectangle", (x, y - 10), cv2.FONT_HERSHEY_SIMPLEX,
            0.5, (0, 255, 255), 2)

cv2.imshow("Image", image)
cv2.waitKey(0)
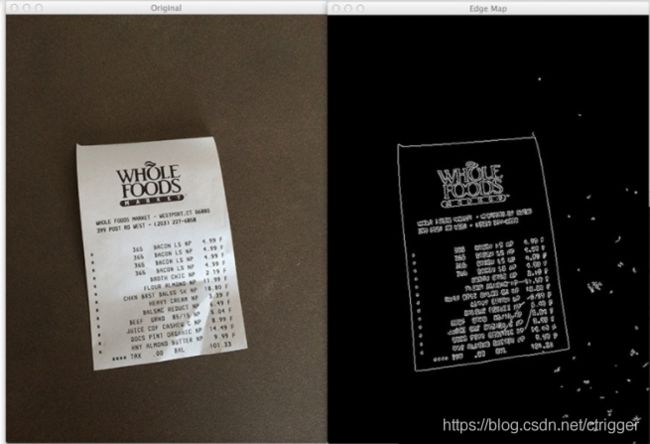
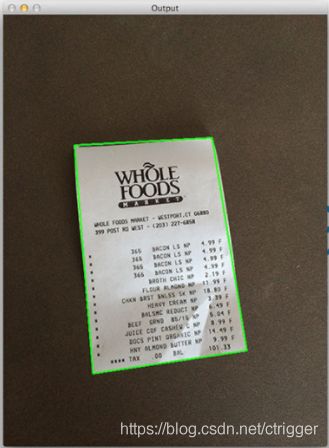
物体轮廓检测:
import cv2

image = cv2.imread("images/receipt.png")
gray = cv2.cvtColor(image, cv2.COLOR_BGR2GRAY)
edged = cv2.Canny(gray, 75, 200)

cv2.imshow("Original", image)
cv2.imshow("Edge Map", edged)

(cnts, _) = cv2.findContours(edged.copy(), cv2.RETR_EXTERNAL, cv2.CHAIN_APPROX_SIMPLE)
cnts = sorted(cnts, key=cv2.contourArea, reverse=True)[:7]

# loop over the contours
for c in cnts:
    peri = cv2.arcLength(c, True)
    approx = cv2.approxPolyDP(c, 0.01 * peri, True)

    print "original: {}, approx: {}".format(len(c), len(approx))

    if len(approx) == 4:
        cv2.drawContours(image, [approx], -1, (0, 255, 0), 2)

cv2.imshow("Output", image)
cv2.waitKey(0)
11.5、排列轮廓
import numpy as np
import argparse
import cv2

#参数1:轮廓列表  参数2:排列方法
def sort_contours(cnts, method="left-to-right"):
    reverse = False
    i = 0

    if method == "right-to-left" or method == "bottom-to-top":
        reverse = True

    if method == "top-to-bottom" or method == "bottom-to-top":
        i = 1

    boundingBoxes = [cv2.boundingRect(c) for c in cnts]
    (cnts, boundingBoxes) = zip(*sorted(zip(cnts, boundingBoxes),
        key=lambda b:b[1][i], reverse=reverse))

    return (cnts, boundingBoxes)


def draw_contour(image, c, i):
    M = cv2.moments(c)
    cX = int(M["m10"] / M["m00"])
    cY = int(M["m01"] / M["m00"])

    cv2.putText(image, "#{}".format(i + 1), (cX - 20, cY), cv2.FONT_HERSHEY_SIMPLEX,
        1.0, (255, 255, 255), 2)

    return image


ap = argparse.ArgumentParser()
ap.add_argument("-i", "--image", required=True, help="Path to the input image")
ap.add_argument("-m", "--method", required=True, help="Sorting method")
args = vars(ap.parse_args())

image = cv2.imread(args["image"])
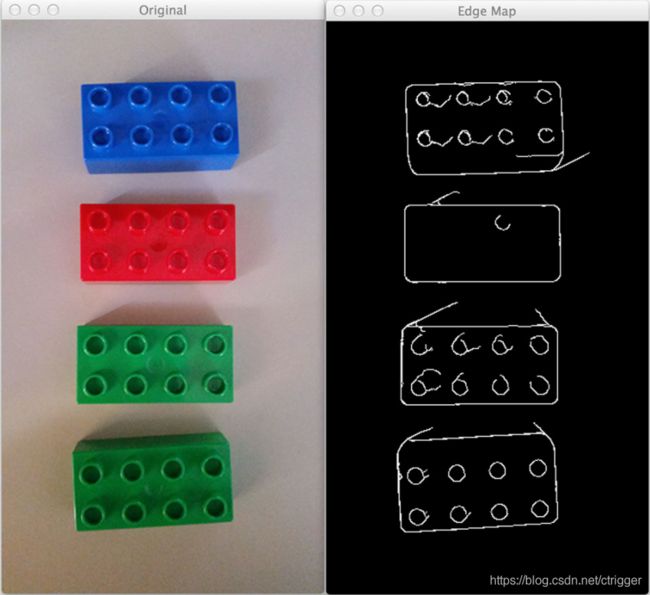
accumEdged = np.zeros(image.shape[:2], dtype="uint8")

for chan in cv2.split(image):
    chan = cv2.medianBlur(chan, 11)
    edged = cv2.Canny(chan, 50, 200)
    accumEdged = cv2.bitwise_or(accumEdged, edged)

cv2.imshow("Edge Map", accumEdged)

(cnts, _) = cv2.findContours(accumEdged.copy(), cv2.RETR_EXTERNAL,
    cv2.CHAIN_APPROX_SIMPLE)
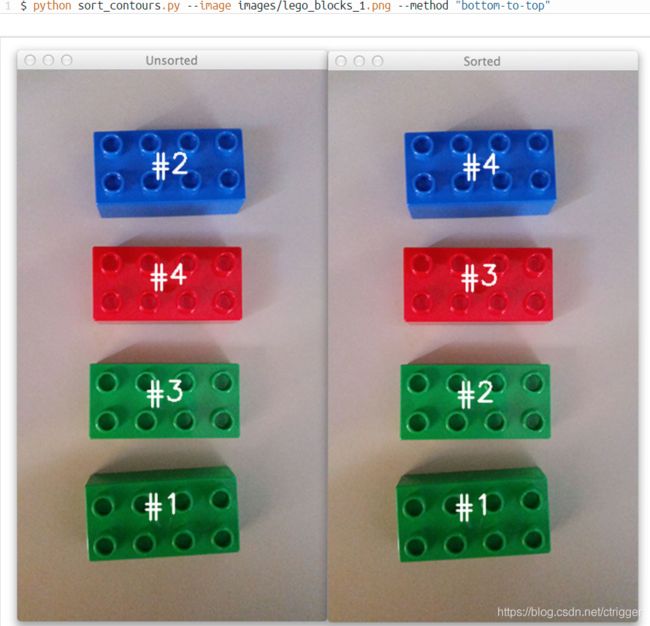
cnts = sorted(cnts, key=cv2.contourArea, reverse=True)[:5]
orig = image.copy()

for (i, c) in enumerate(cnts):
    orig = draw_contour(orig, c, i)

cv2.imshow("Unsorted", orig)

(cnts, boundingBoxes) = sort_contours(cnts, method=args["method"])

for (i, c) in enumerate(cnts):
    draw_contour(image, c, i)

cv2.imshow("Sorted", image)
cv2.waitKey(0)
12、直方图
直方图:表示图像中的像素强度
运用cv2.calcHist函数构建直方图
cv2.calcHist(图像,通道,掩码,histSize,范围)
参数详解:
图像:我们要计算的直方图的图像
通道:索引列表,其中指定要计算直方图的通道的索引。
掩码:提供一个掩码,那么只对被掩盖的像素计算一个直方图
histSize:计算直方图时要使用的分组数
范围:可能的像素值的范围
#灰度直方图
from matplotlib import pyplot as plt
import argparse
import cv2

ap = argparse.ArgumentParser()
ap.add_argument("-i", "--image", required=True, help="Path to the image")
args = vars(ap.parse_args())

image = cv2.imread(args["image"])

image = cv2.cvtColor(image, cv2.COLOR_BGR2GRAY)
cv2.imshow("Original", image)

hist = cv2.calcHist([image], [0], None, [256], [0, 256])

plt.figure()
plt.title("Grayscale Histogram")
plt.xlabel("Bins")
plt.ylabel("# of Pixels")
plt.plot(hist)
plt.xlim([0, 256])

hist /= hist.sum()

plt.figure()
plt.title("Grayscale Histogram (Normalized)")
plt.xlabel("Bins")
plt.ylabel("% of Pixels")
plt.plot(hist)
plt.xlim([0, 256])
plt.show()
#颜色直方图
from matplotlib import pyplot as plt
import argparse
import cv2

ap = argparse.ArgumentParser()
ap.add_argument("-i", "--image", required=True, help="Path to the image")
args = vars(ap.parse_args())

image = cv2.imread(args["image"])
cv2.imshow("Original", image)

chans = cv2.split(image)
colors = ("b", "g", "r")
plt.figure()
plt.title("'Flattened' Color Histogram")
plt.xlabel("Bins")
plt.ylabel("# of Pixels")

for (chan, color) in zip(chans, colors):
    hist = cv2.calcHist([chan], [0], None, [256], [0, 256])
    plt.plot(hist, color = color)
    plt.xlim([0, 256])

fig = plt.figure()

ax = fig.add_subplot(131)
hist = cv2.calcHist([chans[1], chans[0]], [0, 1], None, [32, 32],
    [0, 256, 0, 256])
p = ax.imshow(hist, interpolation="nearest")
ax.set_title("2D Color Histogram for G and B")
plt.colorbar(p)

ax = fig.add_subplot(132)
hist = cv2.calcHist([chans[1], chans[2]], [0, 1], None, [32, 32],
    [0, 256, 0, 256])
p = ax.imshow(hist, interpolation="nearest")
ax.set_title("2D Color Histogram for G and R")
plt.colorbar(p)

ax = fig.add_subplot(133)
hist = cv2.calcHist([chans[0], chans[2]], [0, 1], None, [32, 32],
    [0, 256, 0, 256])
p = ax.imshow(hist, interpolation="nearest")
ax.set_title("2D Color Histogram for B and R")
plt.colorbar(p)

print "2D histogram shape: %s, with %d values" % (
    hist.shape, hist.flatten().shape[0])

hist = cv2.calcHist([image], [0, 1, 2],
    None, [8, 8, 8], [0, 256, 0, 256, 0, 256])
print "3D histogram shape: %s, with %d values" % (
    hist.shape, hist.flatten().shape[0])

plt.show()
#直方图均衡
import argparse
import cv2

# construct the argument parser and parse the arguments
ap = argparse.ArgumentParser()
ap.add_argument("-i", "--image", required=True, help="Path to the image")
args = vars(ap.parse_args())

# load the image and convert it to grayscale
image = cv2.imread(args["image"])
image = cv2.cvtColor(image, cv2.COLOR_BGR2GRAY)

# apply histogram equalization to stretch the constrast of our image
eq = cv2.equalizeHist(image)

# show our images -- notice how the constrast of the second image has
# been stretched
cv2.imshow("Original", image)
cv2.imshow("Histogram Equalization", eq)
cv2.waitKey(0)
#直方图和面具
from matplotlib import pyplot as plt
import numpy as np
import cv2

def plot_histogram(image, title, mask=None):

    chans = cv2.split(image)
    colors = ("b", "g", "r")
    plt.figure()
    plt.title(title)
    plt.xlabel("Bins")
    plt.ylabel("# of Pixels")

    for (chan, color) in zip(chans, colors):
        hist = cv2.calcHist([chan], [0], mask, [256], [0, 256])
        plt.plot(hist, color=color)
        plt.xlim([0, 256])

image = cv2.imread("beach.png")
cv2.imshow("Original", image)
plot_histogram(image, "Histogram for Original Image")
mask = np.zeros(image.shape[:2], dtype="uint8")
cv2.rectangle(mask, (60, 290), (210, 390), 255, -1)
cv2.imshow("Mask", mask)

masked = cv2.bitwise_and(image, image, mask=mask)
cv2.imshow("Applying the Mask", masked)

plot_histogram(image, "Histogram for Masked Image", mask=mask)

plt.show()
13、连接分量标签
略


