从零开始Vue项目中使用MapboxGL开发三维地图教程(五)加载点、线、面图层以及三维面图层(白模)
目录
-
-
- 1、加载点图层
- 2、加载线和面图层
- 3、加载三维面图层(白模)
-
1、加载点图层
开发地图应用时,加载POI等点状数据,显示文字或者图标信息,mapbox-gl对应使用的是符号图层(symbol),下面的代码时使用Mapbox GL JS中的默认Marker方法向地图添加两个标记。
          // Create a default Marker and add it to the map.
          const marker1 = new this.$mapboxgl.Marker()
            .setLngLat([116.03238901390978, 38.913188059745586])
            .addTo(map);

          // Create a default Marker, colored black, rotated 45 degrees.
          const marker2 = new this.$mapboxgl.Marker({
              color: 'black',
              rotation: 45
            })
            .setLngLat([116.03238901390978, 38.913188059745586])
            .addTo(map);
marker1中心坐标116.03238901390978, 38.913188059745586。它使用默认的标记颜色。
marker2使用选项定义新Marker对象的颜色和旋转参数。
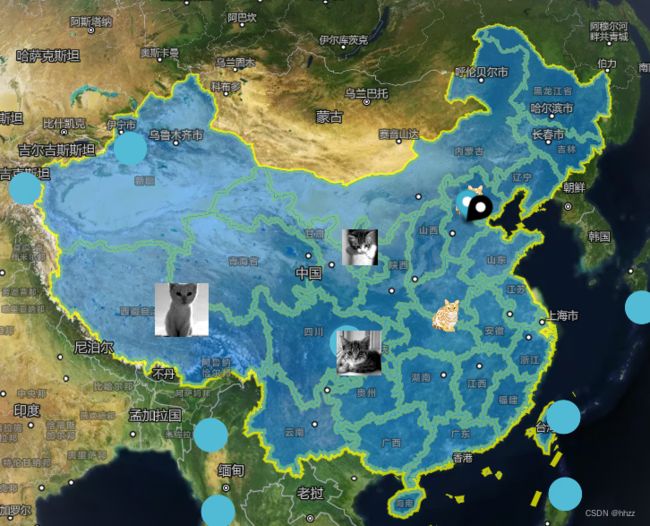
2、加载线和面图层
使用GeoJSON数据源向地图添加一个多边形,
首先使用addSource添加GeoJSON数据,该数据包含一个多边形。然后使用addLayer创建一个新的图层,并设置多边形外观的样式。为了在多边形周围添加轮廓,它再次使用addLayer来创建一个引用相同GeoJSON源的新线层。
代码示例:
          const chinaboundary = require('../assets/chinajson.json');
          console.log(chinaboundary)
          const chinaboundarysource = {
            type: 'geojson',
            data: {
              type: 'FeatureCollection',
              features: chinaboundary.features
            }
          }
          map.addLayer({
            id: 'chinaboundaryline',
            type: 'line',
            source: chinaboundarysource,
            paint: {
              'line-color': 'yellow',
              'line-opacity': 0.75,
              'line-width': 5
            }
          });
          map.addLayer({
            id: 'chinaboundarypolghon',
            type: 'fill',
            source: chinaboundarysource, // reference the data source
            layout: {},
            paint: {
              'fill-color': '#0080ff', // blue color fill
              'fill-opacity': 0.5
            }
          });
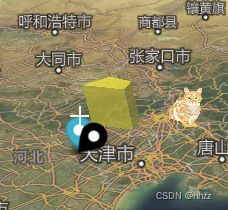
3、加载三维面图层(白模)
实现功能:加载带高度信息的面数据,显示简单建筑(白模)效果
三维面图层在mapbox-gl对应的是填充挤压(fill-extrusion)图层
在mapbox-gl加载fill-extrusion图层过程:通过加载geojson矢量数据,数据源加载完成后,再进行图层的设置。
以geojson数据为例:
 //添加geojson数据源,数据中必须有高度的字符,并且是数字类型的
          map.addSource('buildingdata', {
            'type': 'geojson',
            'data': {
              'type': 'Feature',
              'geometry': {
                'type': 'Polygon',
                "properties": {
                  "height": 20000
                },
                'coordinates': [
                  [
                    [115.720119, 39.685438],
                    [116.155905, 39.724518],
                    [116.275488, 39.548482],
                    [115.548794, 39.372887],
                    [115.720119, 39.685438],
                  ]
                ]
              }
            }
          });
          //添加三维建筑图层,id对应以上
          map.addLayer({
            'id': 'buildingdata',
            'type': 'fill-extrusion',
            'source': 'buildingdata',
            'paint': {
              // 设置填充颜色
              'fill-extrusion-color': '#fff000',
              //从属性中获得高度,这里用的是height字段
              'fill-extrusion-height': ['get', 'height'],
              // 透明度设置
              'fill-extrusion-opacity': 0.8
            }
          });
效果: