SuiteQlet Bundle
Content
1. Foreword
2. Overview
2.1 Glossary
2.2 Features
2.3 Design Description
3. Install
4. Setup
5. Instruction
5.1 Query
5.2 Chart
5.3 Publish Dashboard
6. Note
7. Video Link
1. Foreword
SuiteQL is a powerful tool for data queries in the NetSuite Data Analysis.
- Join Across Multiple Tables
SuiteQL is unique against Saved Search and Dataset on joining among multiple tables. We prefer to get what we want directly from SQL statements.
- Easy Migration
Comparing with bundling Saved Search and Workbook SDF migration, it is much easier to share SuiteQL by copy and paste.
- Reusable
For NetSuite developers, you can reuse the reports based on SuiteQL. It will save much time. Soon or later, you will get a refined collection.
TOI has developed a SuiteQlet Bundle based on the above three points.
2. Overview
2.1 Glossary
- SuiteQlet:A bundle based on SuiteQL.
- SuiteChart: Used to display SuiteQL query results.
2.2 Features
Create or invoke saved SuiteQL to query
Users query through SQL statements. At the same time, you can also save the used SQL statements for later query invoke.
Enter SQL statements
Save the result to Excel
Users can export the data results to an Excel.
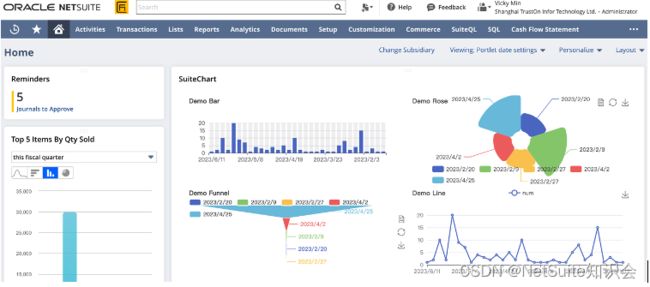
Publish results in the dashboard
Users can preview by chart with you queried the SuiteQL result. And you can save it for your dashboards afterwards.
Publish Dashboard
2.3 Design Description
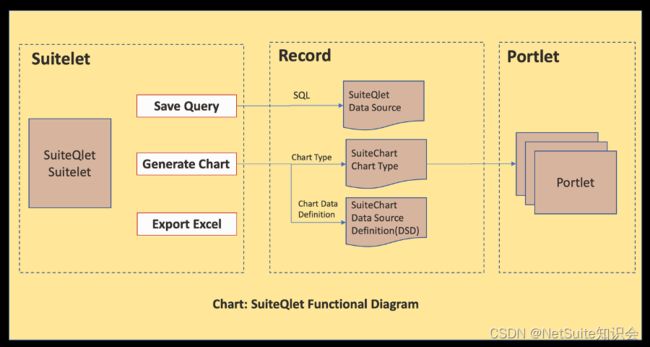
The design of this feature is based on the following 5 custom record types:
| ID |
Name |
Description |
| 1 |
SuiteChart Data Source |
Data Source definition, which can include SuiteQL, Saved Search, and Dataset. |
| 2 |
SuiteChart Chart DSD |
Chart child table, associated with multiple data sources, used for selecting multiple series in chart. |
| 3 |
SuiteChart Chart |
Chart master table, which can be invoked and displayed by Portlets. |
| 4 |
SuiteChart Chart Type |
Definition of chart types. |
| 5 |
SuiteChart Chart Type Param |
The parameters for the chart type. |
You can refer to the table below:
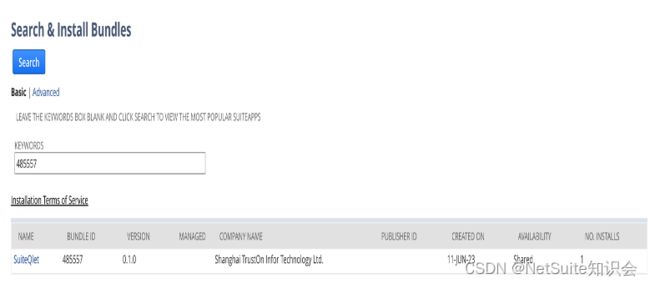
3. Install
| Bundle Name |
SuiteQlet |
| Bundle ID |
485557 |
| Availability |
Public |
| Code Control |
Locked |
4. Setup
The feature requires full access to custom record types.
5. Instruction
5.1 Query
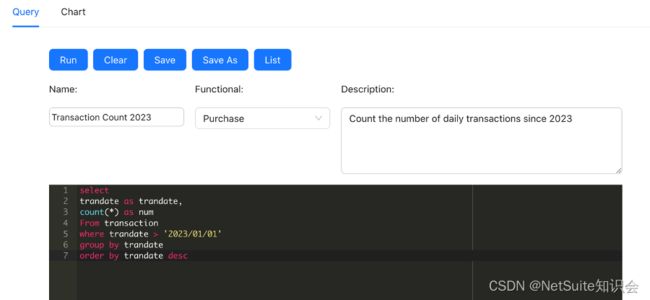
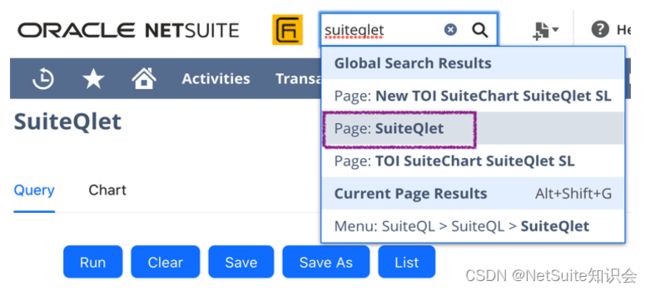
Through global search, the keyword Page: SuiteQlet is used to obtain the function.
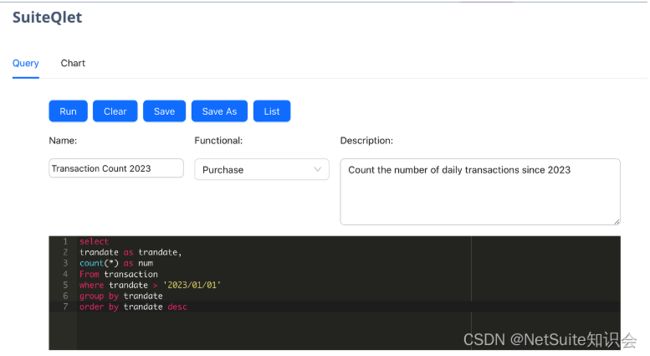
Open SuiteQlet and Edit:
Create/Invoke SQL statements
Show Results
Operation & Description
| ID |
Operation |
Description |
| 1 |
Run |
Run the SQL statement in the editor. Click the button and the data query results will be displayed at the bottom of the interface. At the same time, the word "Successfully Run SuiteQL" will appear on the interface. |
| 2 |
Clear |
Clear the SQL statement in the editor. |
| 3 |
Save |
Save the SQL statement in the editor for later query invoke. At the same time, the word " Successfully Saved " will appear on the interface. |
| 4 |
Save As |
Save As the SQL statement in the editor. |
| 5 |
List |
Show all saved SQL statements, which can be searched using keywords in Search. When the user clicks Load, the interface will refresh the SQL statement into the editor. |
| 6 |
Name |
Customized queries, such as Count Transactions. |
| 7 |
Functional |
Customer Service,Financial,Human Resource,Manufacture,Marketing,Purchase,Quality Management,R&D,Sales,Warehouse. |
| 8 |
Description |
Enter a description of the current query operation to help users to select. For example, it is used to Count the number of daily transactions since 2023/01/01. |
| 9 |
Export Excel |
Export the data results to an Excel. |
About SuiteQL Sample Library
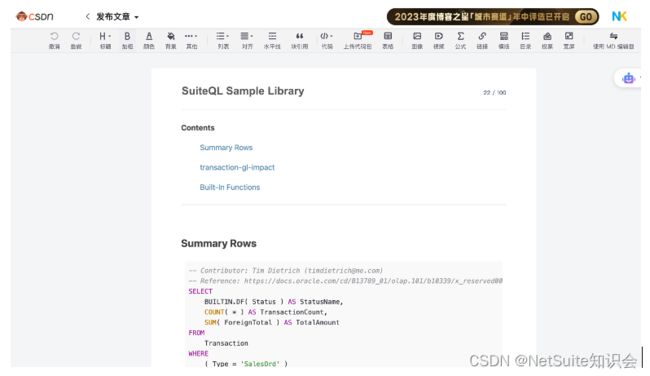
A post in NetSuite Knowledge Community ——SuiteQL Sample Library, will play a role to share samples, which is regularly updated. If you would like to share, it is highly appreciated for your comments at the post.
The link as following:
SuiteQL Sample Library_NetSuite知识会的博客-CSDN博客SuiteQL Sample Libraryhttps://nk-community.blog.csdn.net/article/details/130669113
5.2 Chart
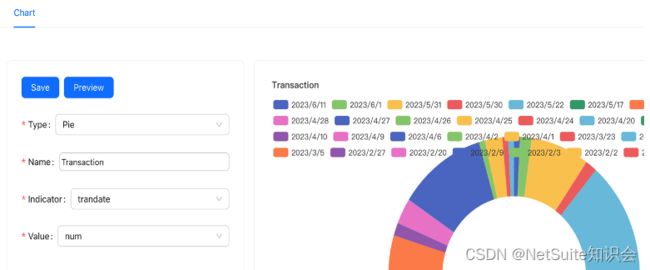
Preview Chart
Operation & Description
| ID |
Operation |
Description |
| 1 |
Save |
Save the chart for your dashboards afterwards. |
| 2 |
Preview |
Preview by chart with you queried the SuiteQL result. |
| 3 |
Type |
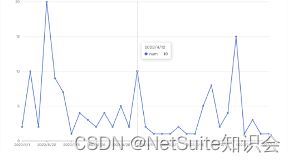
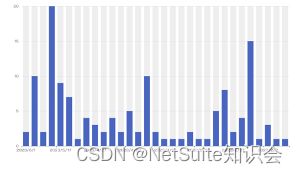
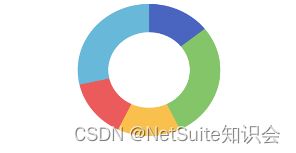
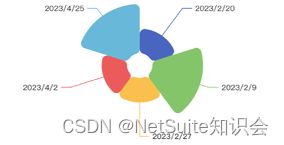
6 types of charts available for users to choose and use based on different scenarios. |
| 4 |
Name |
Customized charts, such as Count Transactions. |
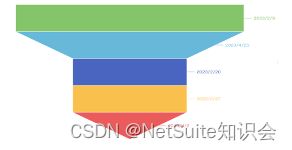
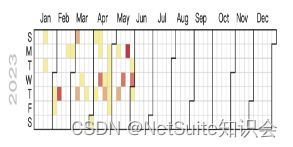
6 Types of Charts & Description
5.3 Publish Dashboard
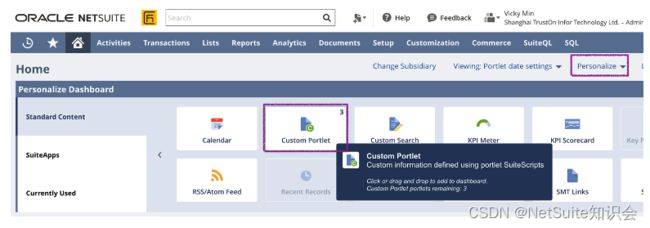
Click Personalize and select Custom Portlet to add.
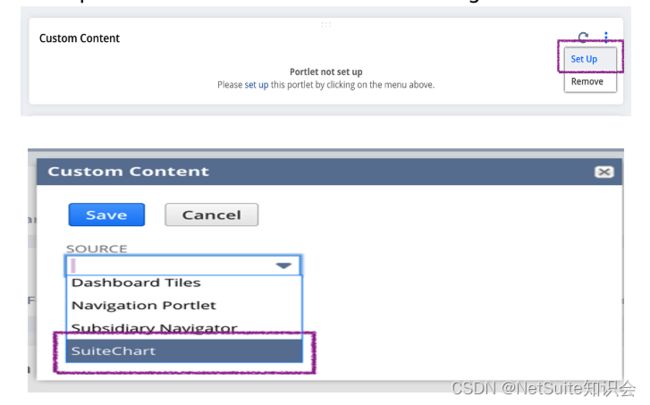
Open Custom Content and click Set Up; And then select SuiteChart from the Source drop-down list and click Save to save the settings.
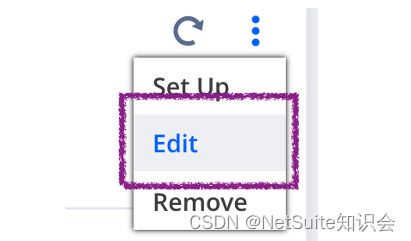
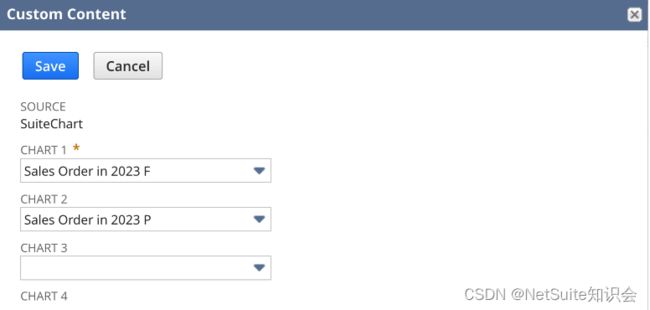
Open the component again in the upper right corner and click Edit to complete the selection of the required chart. Please note users can select 4 charts at maximum in a single portlet.
Users can choose different Layouts according to your needs (currently available as 1 * 1, 1 * 2, 1 * 3, 2 * 2). After filling in the Height and Title Name of the portlet, click Save to save the settings.
Finish publish dashboard.
Dashboard
6. Note
a) After installing the bundle, administrators can customize the path for SuiteQlet.
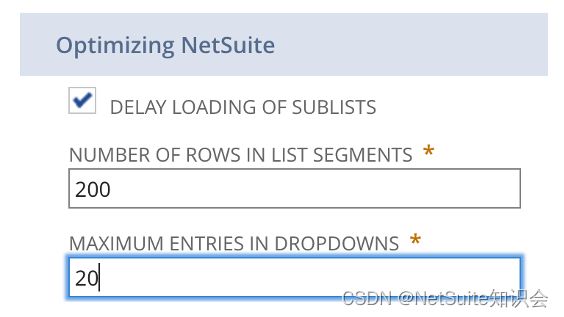
b) When selecting charts in the final publish dashboard, it is important to note that the number of charts displayed in the list cannot exceed the parameter Maximum entries in dropdowns set by personal preferences. Otherwise, there may be a situation where the chart is loaded without displaying its name as shown in the following picture. Assuming that the maximum display of the personal preference list is 20, when the number of saved charts in the system exceeds 20, the list cannot be displayed. You need to return to the settings for changing personal preferences. Currently, NetSuite Release 23.1 has this issue.
Setup Personal Preference
c) Click Run on the Query to generate data results, otherwise no charts will be generated on the Chart.
d) If you need to delete the saved SQL statements in the list, you need to select the custom record to delete in the SuiteChart Data Source List.
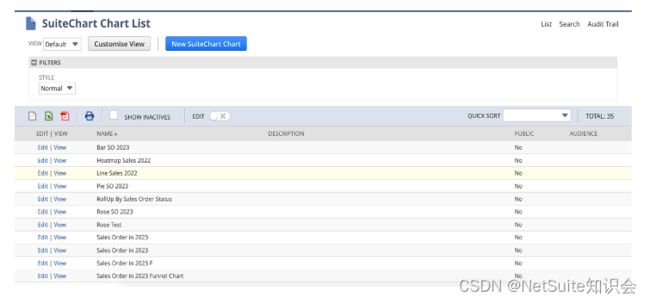
e) If you need to delete the saved charts, you need to select the custom record to delete in the SuiteChart Chart List.
f) Line/Rose/Funnel can be downloaded and saved as images after generation, while Bar/Pie/Calendar Heatmap cannot be downloaded and saved as images after generation.
g) If you have any problems during installation or use, you can send an email to [email protected] contact us.
7. Video Link
NK Bundles——SuiteQlet
