react笔记_14在react中使用echarts
目录
-
-
- echarts官网
- 在项目引入echarts
-
- [1]下载
- [2-1] 全量引入
- [2-2]按需引入
-
- 问题 - 仅引入核心模块
- 图表配置
-
- 公共配置
-
- y轴文本样式
- [1] 柱状图(bar)
-
- 横/纵向柱状图
- [2] 漏斗图(funnel)
-
- 漏斗图的形状
-
echarts官网
echarts官网
在项目引入echarts
[1]下载
npm install echarts
[2-1] 全量引入
import * as echarts from 'echarts';
全量引入指的是引入了echarts的核心模块、全部图表以及图表所能用到的组件。
若是你的项目仅仅是使用1个或少数图表,建议使用按需引入。。。
[2-2]按需引入
- 引入 echarts 核心模块
import * as echarts from "echarts/lib/echarts"; - 按需引入需要的图表及组件,如下
// 引入柱状图以及漏斗图 import { FunnelChart, BarChart } from 'echarts/charts'; // 引入组件 import { GridComponent, TitleComponent, TooltipComponent, LegendComponent } from 'echarts/components'; // 注册 echarts.use([FunnelChart, BarChart, GridComponent, TitleComponent, TooltipComponent, LegendComponent]); - 配置项渲染dom
const chartDom = useRef()
const option = {...}
const  myChart = echarts.init(chartDom.current)
myChart.setOption(option)
问题 - 仅引入核心模块
以echarts官网快速入门案例为例讲解一些如果仅引入核心模块就进行option配置会出现什么问题~
- [1] 引入echarts核心模块
import * as echarts from "echarts/lib/echarts"; - [2] 配置option并渲染dom
此时会报错如下useEffect(async () => { const option = { title: { text: 'ECharts 入门示例' }, tooltip: {}, legend: { data: ['销量'] }, xAxis: { data: ['衬衫', '羊毛衫', '雪纺衫', '裤子', '高跟鞋', '袜子'] }, yAxis: {}, series: [ { name: '销量', type: 'bar', data: [5, 20, 36, 10, 10, 20] } ] } const myFunnelChart = echarts.init(funnelchartDom.current) myFunnelChart.setOption(option) },[]);
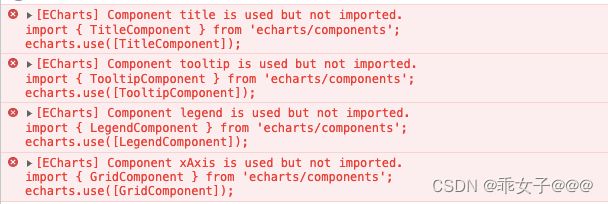
按照上述报错引入所需组件
此时不报错了,但是展示的图表如下(并没有达到所需效果)import { GridComponent, TitleComponent, TooltipComponent, LegendComponent } from 'echarts/components'; echarts.use([ GridComponent, TitleComponent, TooltipComponent, LegendComponent]);
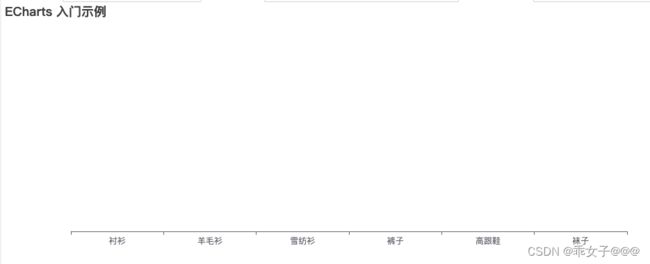
但是此时也不报错了,此时找错误变得艰难起来,其实就是没有引入图表而已, 引入图表之后就能正常显示了~import { BarChart } from 'echarts/charts'; import { GridComponent, TitleComponent, TooltipComponent, LegendComponent } from 'echarts/components'; echarts.use([ BarChart, GridComponent, TitleComponent, TooltipComponent, LegendComponent]);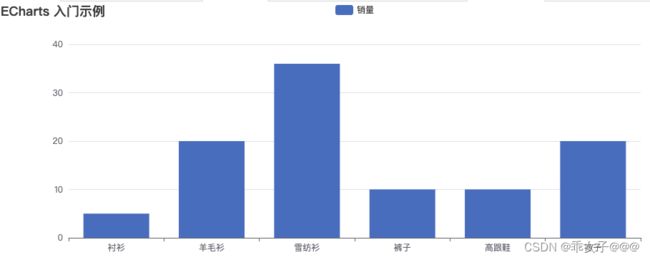
当然这个问题也很少有人会犯这个错误,只是第一次引入不熟悉流程才有可能~
图表配置
公共配置
y轴文本样式

在默认情况下,y轴的文本样式如上图,若是接受上图样式,则在配置时仅需配置y轴的显示文本即可,如下:
  yAxis: {
    type: 'category', // 类目轴
    data: ['toutiao51t', 'toutiao61t', 'toutiao25c', 'toutiao21t', 'toutiao52t', 'toutiao53t', 'toutiao12t', 'toutiao26t', 'toutiao18t', 'toutiao54t'], // 类目文本
    axisLine: { show: false },
    axisTick: { show: false },
    splitLine: { show: false },
    inverse: true // 数据倒序排列
  },
若是样式不符合要求,比如想要显示文本颜色为红色,可进行如下配置
const data = ['toutiao51t', 'toutiao61t', 'toutiao25c', 'toutiao21t', 'toutiao52t', 'toutiao53t', 'toutiao12t', 'toutiao26t', 'toutiao18t', 'toutiao54t']
const yData = res.data.map(item=>({
  value: item.value, // 类目文本
  textStyle: {
    fontSize: 14,
    color: 'red'
  } // 文本样式
}))

yAxis: {
  type: 'category',
  data: yData,
  axisLine: { show: false },
  axisTick: { show: false },
  splitLine: { show: false },
  inverse: true
}
[1] 柱状图(bar)
横/纵向柱状图
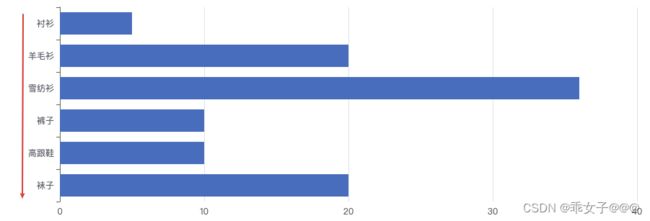
在柱状图中是分为x轴与y轴的,默认情况下x轴表示类目的y轴表示数量,但是若是我们需要 横向柱状图如下,那应该如何配置呢?
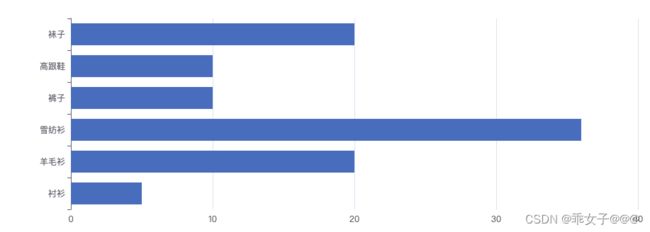
在xAxis与yAxis配置项中都存在
type属性,属性值有4个分别如下:
- value 数值轴 (y轴默认值)
- category 类目轴 (x轴默认值)
注: 可用data属性直接设置类目数据(不设置type属性)- time 时间轴
- log 对数轴
若想x轴与y轴对调,仅需将xAxis与yAxis的type属性值对调即可,如下
const option = {
  xAxis: {},
  yAxis: {
    data: ['衬衫', '羊毛衫', '雪纺衫', '裤子', '高跟鞋', '袜子']
  },
  series: [
    {
      name: '销量',
      type: 'bar',
      data: [5, 20, 36, 10, 10, 20]
    }
  ]
}
虽然此时显示的是横向柱状图,但是数据的排列顺序是从下往上排列,看起来与我们设置的数据顺序是相反的(因为设置爹第一个数据是衬衫,总觉得此时第一个应该是衬衫,但是实际衬衫在最下面)
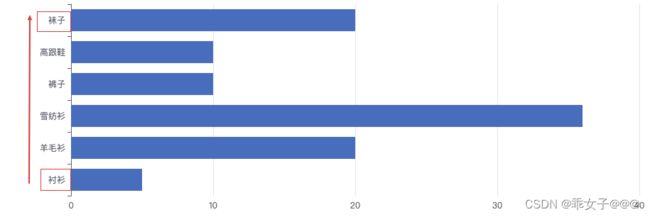
其实xAxis/yAXis配置项中存在
inverse数据-> 是否是反向坐标轴
  yAxis: {
    data: ['衬衫', '羊毛衫', '雪纺衫', '裤子', '高跟鞋', '袜子'],
    inverse: true
  },
[2] 漏斗图(funnel)
option = {
  series: [
    {
      type: 'funnel', // 图表类型
      left: '10%',
      top: 60,
      bottom: 60,
      width: '80%',
      min: 0, // value最小值
      max: 100, // value最大值
      minSize: '0%', // 最小值映射的宽度(最小宽度)
      maxSize: '100%', // 最大值映射块的宽度(最大宽度)
      // sort: 数据排列顺序 descending(默认)从大到小排列;ascending:从小到大排列;none:按照data(value属性)值排列
      sort: 'descending',
      // gap: 图表块与块之间的间距
      gap: 2,
      // label: 图表每块上的文本
      label: {
        show: true, // 是否显示文本(默认true)
        position: 'inside', //  文本显示的位置(默认块右侧)
        formatter: function(d){ // 文本内容,默认name属性
          return d.data.name + '  ' + d.data.num
        }
      },
      // 图表每个块的样式
      itemStyle: {
        // color:'red',   表示每个块都是红色,默认是在option.color中选取颜色
        borderColor: '#fff',
        borderWidth: 1
      },
      // 鼠标hover时块的样式
      emphasis: {
        // 文本样式
        label: {
          fontSize: 20
        }
      },
      // 显示数据
      data: [
        { value: 60, name: 'Visit', num: 5000 },
        { value: 40, name: 'Inquiry', num: 3200 },
        { value: 20, name: 'Order', num: 10 },
        { value: 80, name: 'Click' , num: 6800},
        { value: 100, name: 'Show', num: 10000 }
      ]
    }
  ]
};
漏斗图的形状
在看案例时,发现图表是一个“三角形”的形状,但是在我们实际使用时会发现图表存在变形的情况
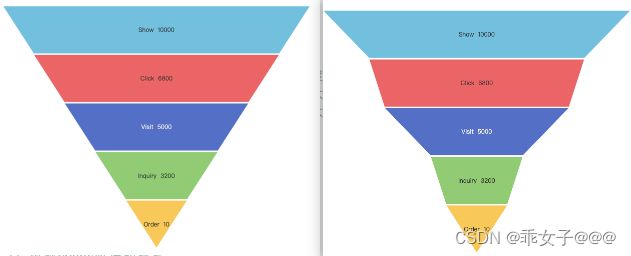
漏斗图的形状是通过
data.value属性控制的,若是每个数据的data.value属性的递减/递增不是成比例的就会出线漏斗图三角形变形的情况。
若是想要图形一直是三角形,可以将value值做成递减,在data中添加另一个属性来表示真正的数值(注:若是后端的返回值不是按照顺序返回的,需要先排序!)
