时序预测 | Matlab+Python实现基于高斯混合模型聚类结合CNN-BiLSTM-Attention的风电场短期功率预测
时序预测 | Matlab+Python实现基于高斯混合模型聚类结合CNN-BiLSTM-Attention的风电场短期功率预测
目录
-
- 时序预测 | Matlab+Python实现基于高斯混合模型聚类结合CNN-BiLSTM-Attention的风电场短期功率预测
-
- 效果一览
- 基本介绍
- 模型描述
- 程序设计
- 参考资料
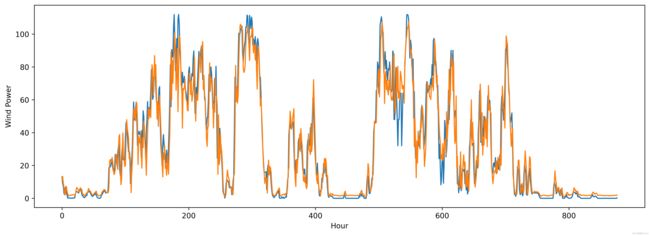
效果一览
基本介绍
基于高斯混合模型聚类结合CNN-BiLSTM-Attention的风电场短期功率预测(Matlab+Python完整源码和数据)
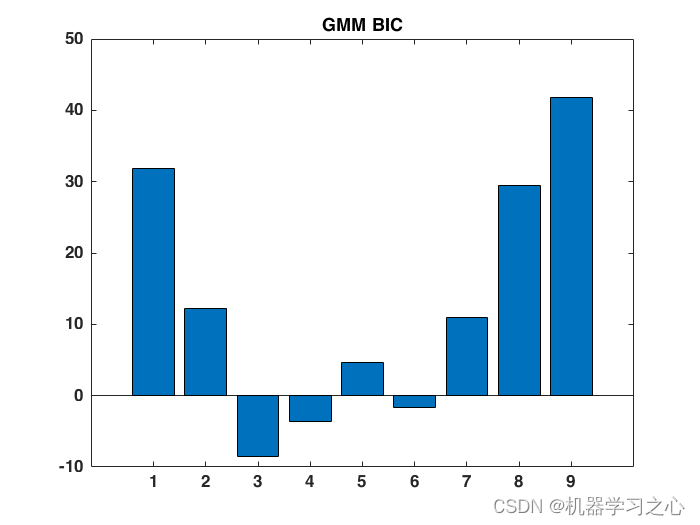
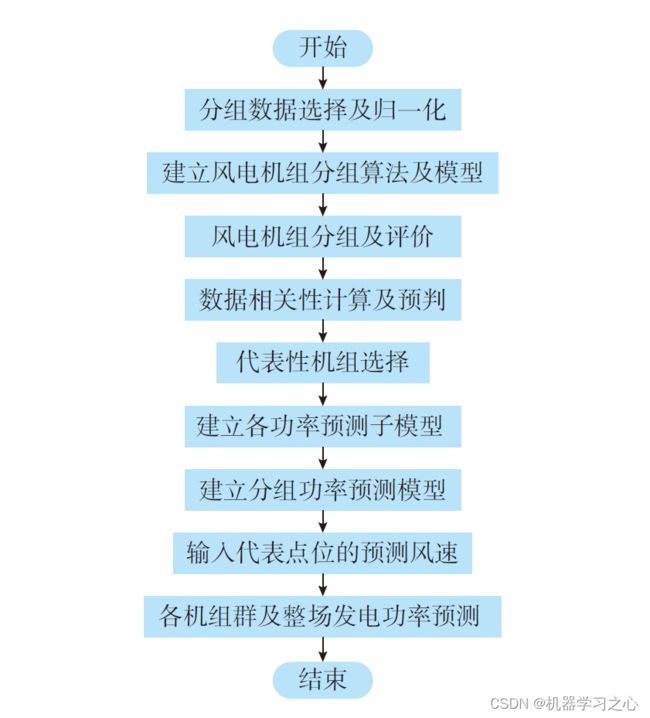
该方法结合数据分布特征,利用 GMM 聚类将大型风电场划分为若干机组群,借助贝叶斯信息准则指标评价,获得风电场内最优机组分组方案。最后,基于CNN-BiLSTM-Attention的功率预测方法,验证所提聚类方法的有效性以及相较于其他聚类方法的优越性。
1.先运行data_process.m 能得到cluster.csv文件;
2.之后运行main.py进行预测,会得到results文件夹以及里面的结
果和图片
3.最后运行result_analysis.m进行数据分析,Python用的是Keras。
模型描述
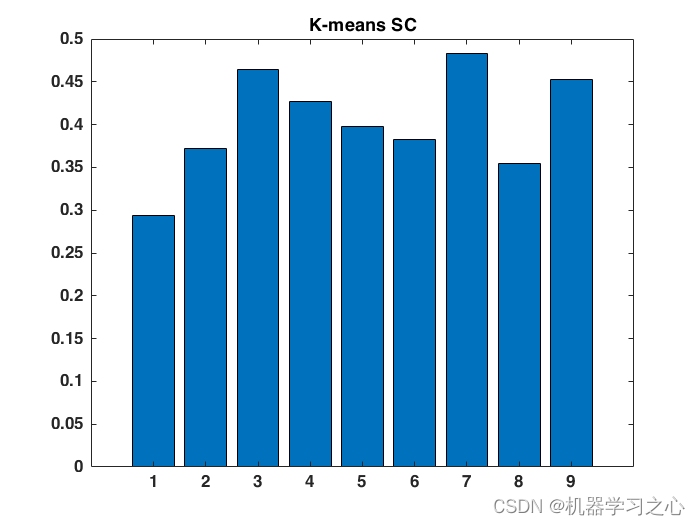
对任意来流条件下的风电场发电功率进行准确预测,是提高电网对风电接纳能力的有效措施。针对大型风电场的功率预测采用单点位风速外推预测代表性差的局限,提出基于高斯混合模型(GMM)聚类的风电场短期功率预测方法。方法结合数据分布特征,利用GMM 聚类将大型风电场划分为若干机组群,借助贝叶斯信息准则指标评价,获得风电场内最优机组分组方案。算例表明,所建立的GMM 聚类模型均极大地提高了风电功率预测模型的准确性。相较于应用广泛的k-means 聚类、层次凝聚聚类等方法,GMM 聚类方法在分组功率预测中表现出了显著优势,为大型风电场短期功率预测模型的优化及运行经济性的提升提供了技术支持与依据。
程序设计
- 完整程序和数据下载方式1(资源处直接下载):Matlab+Python实现基于高斯混合模型聚类结合CNN-BiLSTM-Attention的风电场短期功率预测
- 完整程序和数据下载方式2(订阅《CNN-DL卷积深度学习模型》专栏,同时可阅读《CNN-DL卷积深度学习模型》专栏收录的内容,本篇文章数据订阅后私信我获取):Matlab+Python实现基于高斯混合模型聚类结合CNN-BiLSTM-Attention的风电场短期功率预测
- 完整程序和数据下载方式3(订阅《组合优化》专栏,同时获取《组合优化》专栏收录程序6份,数据订阅后私信我获取):Matlab+Python实现基于高斯混合模型聚类结合CNN-BiLSTM-Attention的风电场短期功率预测
from __future__ import print_function

import argparse
import os

import matplotlib.pyplot as plt
import numpy as np
import pandas as pd

from model import train_model

parser = argparse.ArgumentParser()
parser.add_argument('--model_name', type=str, default='CNN_BiLSTM', choices=['CNN_BiLSTM_Attn', 'CNN_BiLSTM'])
parser.add_argument('--epochs', type=int, default=600, help="Epochs")
parser.add_argument('--batch_size', type=int, default=256, help="Batch Size")
parser.add_argument('--learning_rate', type=float, default=0.001, help="Learning rate")
parser.add_argument('--sequence_length', type=int, default=10, help="sequence length")
parser.add_argument('--dataset', type=str, default='all', choices=['cluster1', 'cluster2', 'cluster3', 'all'])
parser.add_argument('--path', type=str, default='./results/')
args = parser.parse_args()

if not os.path.exists(args.path):
    os.mkdir(args.path)


def convertSeriesToMatrix(vectorSeries, sequence_length):
    """
    滑动时间窗口处理
    """
    matrix = []
    for i in range(len(vectorSeries) - sequence_length + 1):
        matrix.append(vectorSeries[i: i + sequence_length])
    return matrix


if args.dataset in {'cluster1', 'cluster2', 'cluster3'}:
    df = pd.read_csv(args.dataset + '.csv')
    wind = np.array(df)
elif args.dataset == 'all':
    X_files = os.listdir(os.getcwd() + '/dataset')
    if '.gitignore' in X_files: X_files.remove('.gitignore')
    X_files = np.array(X_files)
    wind = []
    for filename in X_files:
        df = pd.read_csv(os.getcwd() + '/dataset/' + filename)
        data = df.values
        wind.append(data[:, 0])
    wind = np.sum(wind, axis=0).reshape(-1, 1)

list_hourly_data = [wind[i] for i in range(0, wind.shape[0]) if i % 12 == 0]
wind_data = np.array(list_hourly_data)

# min-max归一化处理
MAX_MIN = []
for i in range(wind_data.shape[1]):  # 取每一列
    temp_max = np.max(wind_data[:, i])
    temp_min = np.min(wind_data[:, i])  # 第i列最小值
    wind_data[:, i] = (wind_data[:, i] - temp_min) / (temp_max - temp_min)  # 归一化
    # wind_data[:, i] = wind_data[:, i] / temp_max # 归一化
    MAX_MIN.append([temp_max, temp_min])

MAX_NUM = MAX_MIN[0][0]
MIN_NUM = MAX_MIN[0][1]

matrix_load = convertSeriesToMatrix(wind_data, args.sequence_length)  # 滑动时间窗口,窗口长度可以改
matrix_load = np.array(matrix_load).astype(np.float32)  # matrix_load转为ndarray

# 分为训练集与测试集,训练集占90%
train_row = int(round(0.9 * matrix_load.shape[0]))
train_set = matrix_load[:train_row, :]

np.random.shuffle(train_set)  # 打乱训练集,测试集不用打乱

X_train = train_set[:, :-1]  # 训练集
y_train = train_set[:, -1, 0].reshape(-1, 1)  # 训练集label

X_test = matrix_load[train_row:, :-1]  # 测试集
y_test = matrix_load[train_row:, -1, 0].reshape(-1, 1)  # 测试集label

X_train = np.reshape(X_train, (X_train.shape[0], X_train.shape[1] * X_train.shape[2], 1))
X_test = np.reshape(X_test, (X_test.shape[0], X_test.shape[1] * X_test.shape[2], 1))

# =====================================
# ========= 载入模型,开始训练 =========
# =====================================
input_shape = X_train.shape[1:]

model = train_model(args.model_name, input_shape=input_shape)

model.summary()  # print model 结构
history = model.fit(X_train, y_train, batch_size=args.batch_size, epochs=args.epochs, validation_split=0.05, verbose=1)  # 开始训练
# model.save(args.path + args.model_name + '_' + args.dataset + 'model.h5')  # 保存模型

# =====================================
# ============ 训练结果评估 ============
# =====================================

# 预测测试集
predicted_values = model.predict(X_test)
num_test_samples = len(predicted_values)
predicted_values = np.reshape(predicted_values, (num_test_samples, 1))

# 评估训练结果
test_mse = model.evaluate(X_test, y_test, verbose=1)
print('\nThe mean squared error (MSE) on the test data set is %.3f over %d test samples.' % (test_mse[0], len(y_test)))

# 反归一化
predicted_values = predicted_values * (MAX_NUM - MIN_NUM) + MIN_NUM
y_test = y_test * (MAX_NUM - MIN_NUM) + MIN_NUM
y_train = y_train * (MAX_NUM - MIN_NUM) + MIN_NUM

# 画图
fig = plt.figure(figsize=(15, 5), dpi=600)
plt.plot(y_test)
plt.plot(predicted_values)
plt.xlabel('Hour')
plt.ylabel('Wind Power')
# plt.show()
fig.savefig(args.path + args.model_name + '_' + args.dataset + '_output.png', bbox_inches='tight')

# MSE 损失函数
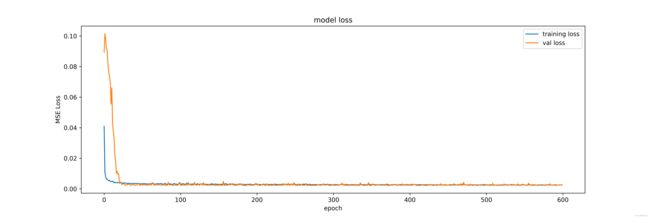
fig = plt.figure(figsize=(15, 5), dpi=600)
plt.plot(history.history['loss'], label='training loss')
plt.plot(history.history['val_loss'], label='val loss')
plt.title('model loss')
plt.ylabel('MSE Loss')
plt.xlabel('epoch')
plt.legend(loc='upper right')
fig.savefig(args.path + args.model_name + '_' + args.dataset + '_loss.png')

# MAE
fig = plt.figure(figsize=(15, 5), dpi=600)
plt.plot(history.history['mae'], label='training mae')
plt.plot(history.history['val_mae'], label='val mae')
plt.title('model MAE')
plt.ylabel('MAE')
plt.xlabel('epoch')
plt.legend(loc='upper right')
fig.savefig(args.path + args.model_name + '_' + args.dataset + '_mae.png')

# RMSE
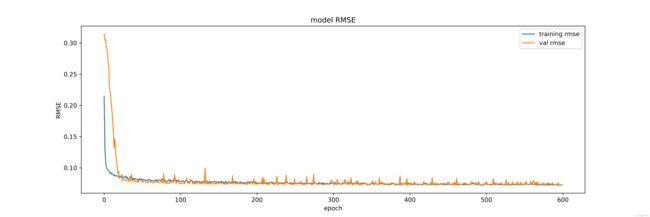
fig = plt.figure(figsize=(15, 5), dpi=600)
plt.plot(history.history['root_mean_squared_error'], label='training rmse')
plt.plot(history.history['val_root_mean_squared_error'], label='val rmse')
plt.title('model RMSE')
plt.ylabel('RMSE')
plt.xlabel('epoch')
plt.legend(loc='upper right')
fig.savefig(args.path + args.model_name + '_' + args.dataset + '_rmse.png')

# 将预测结果保存成csv文件
data = np.hstack((predicted_values, y_test))
df = pd.DataFrame(data, columns=['predicted', 'real'])
df.to_csv(args.path + args.model_name + '_' + args.dataset + '_result.csv')

# MSE loss 和 MAE 保存成csv文件
df = pd.DataFrame(history.history)
df.to_csv(args.path + args.model_name + '_' + args.dataset + '_loss.csv')
参考资料
[1] https://blog.csdn.net/kjm13182345320/article/details/129215161
[2] https://blog.csdn.net/kjm13182345320/article/details/128105718
