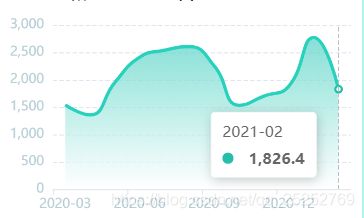
vue移动端中使用echart折线面积图(设置渐变色)解决ios6/11渐变色不显示bug
前言:
1.折线本身渐变色
2.折线阴影面积渐变色
效果如图所示:
1.全局引入echart
main.js
// 如果全局引入就在此加上这两行代码
// 如果就一个页面直接页面引入完事儿 import echarts from 'echarts';
// import * as echarts from 'echarts';
import echarts from 'echarts';
Vue.prototype.$echarts = echarts;
index.vue
series: [
  {
   name: '折线呀',
   type: 'line',
   data: [1,2,3,4,5],
   smooth: true,
   showSymbol: false,
   // 核心
   //此处color如果使用rgba一定要写透明度参数,否则ios6/11下,会导致图表不展示
   areaStyle: { //渐变面积图
     color: new this.$echarts.graphic.LinearGradient(0, 0, 0, 1, [
       {offset: 0, color: 'rgb(82, 210, 196)'},
       {offset: 1, color: 'rgb(255, 255, 255)'}
     ]),
   },
   itemStyle:{//线本身渐变图
	  normal:{
	    color: {
	      type: 'linear',
	      x: 0,
	      y: 0,
	      x2: 0,
	      y2: 1,
	      colorStops: [{
	        offset: 0, color: 'red' // 0% 处的颜色
	      }, {
	        offset: 1, color: 'blue' // 100% 处的颜色
	      }],
	      global: false // 缺省为 false
	    }
	  }
	},
]
2.单页面引入echart.vue
// 单页直接引入 重要
import echarts from 'echarts';

series: [
  {
   name: '折线呀',
   type: 'line',
   data: [1,2,3,4,5],
   smooth: true,
   showSymbol: false,
    // 核心
   //此处color如果使用rgba一定要写透明度参数,否则ios6/11下,会导致图表不展示
   areaStyle: {
     color: new echarts.graphic.LinearGradient(0, 0, 0, 1, [
       {offset: 0, color: 'rgb(82, 210, 196)'},
       {offset: 1, color: 'rgb(255, 255, 255)'}
     ]),
   },
   itemStyle:{//线本身渐变图
	  normal:{
	    color: {
	      type: 'linear',
	      x: 0,
	      y: 0,
	      x2: 0,
	      y2: 1,
	      colorStops: [{
	        offset: 0, color: 'red' // 0% 处的颜色
	      }, {
	        offset: 1, color: 'blue' // 100% 处的颜色
	      }],
	      global: false // 缺省为 false
	    }
	  }
	},
]
完整代码
<div id="line" style="width: 100%;height:200px;"></div>
import echarts from 'echarts';

lineChart() {
   let myChart = echarts.init(document.getElementById('line'));
   let option = {
     tooltip: {
       trigger: 'axis',
     },
     grid: {
       left: '0',
       right: '0',
       bottom: '10',
       top:'20',
       containLabel: true
     },
     xAxis: [
       {
         type: 'category',
         // boundaryGap: false,
         data: [1,2,3,4,5],
         splitLine: {
           show: false,
         },
         axisLine: {
           lineStyle: {
             type: 'solid',
             color: '#E6E7EC',//左边线的颜色
             width:'1'//坐标线的宽度
           }
         },
         axisLabel: {
           textStyle: {
             color: '#B8CED6',//坐标值得具体的颜色
           }
         }
       }
     ],
     yAxis: [
       {
         type: 'value',
         minInterval:1,
         splitLine: {
           show: true,
           lineStyle:{
             type:'dashed'
           }
         },
         axisLine: {
           lineStyle: {
             type: 'solid',
             color: '#E6E7EC',//左边线的颜色
             width:'1'//坐标线的宽度
           }
         },
         axisLabel: {
           textStyle: {
             color: '#B8CED6',//坐标值得具体的颜色
           }
         }
       }
     ],
     color: 'rgba(37, 190, 171, 1)',
     series: [
       {
         name: '',
         type: 'line',
         data: [2.3.4,6,7],
         smooth: true,
         showSymbol: false,
         areaStyle: {
           color: new echarts.graphic.LinearGradient(0, 0, 0, 1, [
             {offset: 0, color: 'rgb(82, 210, 196)'},
             {offset: 1, color: 'rgb(255, 255, 255)'}
           ]),
         },
         // itemStyle:{
         //   normal:{
         //     color: {
         //       type: 'linear',
         //       x: 0,
         //       y: 0,
         //       x2: 0,
         //       y2: 1,
         //       colorStops: [{
         //         offset: 0, color: 'red' // 0% 处的颜色
         //       }, {
         //         offset: 1, color: 'blue' // 100% 处的颜色
         //       }],
         //       global: false // 缺省为 false
         //     }
         //   }
         // }
       }
     ]
   }
   // 使用刚指定的配置项和数据显示图表。
   myChart.setOption(option);
   myChart.dispatchAction({ //设置激活第一个选项
     type: 'showTip',
     seriesIndex: 0,
     dataIndex: 0
   });
 },
备注:
樱花开了,梦幻啊。

