Logistic Regression And Regularization
Prior to it , we learn a classic regression algorithm.Now I will show you a case of another important superviser learning:Logistic regression.
Please heeding! 'Logistic regression' is not a regression though its name contains 'regression'. It is a specifical algorithm to transform the expression of binary linear regression. you can get a estimation percentage instead of unlogical regression result.Because, It belongs to classification algorithms.
Maybe this santences is also unintelligible,now let‘s to describe it step by step.
Why we don't use the linear Regression to solve Binary Regression Problems?
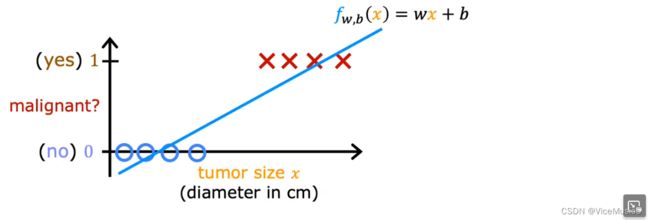
let’s see this situation:you are a tumor specialized doctor。In your medical living,you have token p part in operation many times and go through mang size data。From experiment,you can easily judge whether the tumor is benign or maglignant by its size。
Well,you get a binary target value graph when you put the data to a graph
(About axis: “yes or no” denotes as Y ,the size of tumor denotes as X)
In this graph,yep,we can use linear model to regress and that is no problem.
In general,we should set a threshold(communly 0.5 in this binary question).If the prediction value exceeds threshold,declares malignant。If the prediction value is less then threshold,declares benign。
So,get a linear model
When I get a newly data and perdict a result “0.7”,I can annource that this tumor is malignant......
But in fact,this tumor is benign.
This is a unlogical error ! We can say "a malignant tumor with 70% probability",but not "0.7 tumor".We want to get a more scientifical and reasonable result,not just a calm num。
Based on this,logistic regression can transform the pure number result to a estimation result。“It has 70% probability to assert this tumor is malignant。” This sentance is logical,in my view。
How to start logistic regression?
Before starting,I must tell you Logistic regression is not regression but classification algorithm.It can be regard as a specialized method what is used to logically solve binary linear regression.
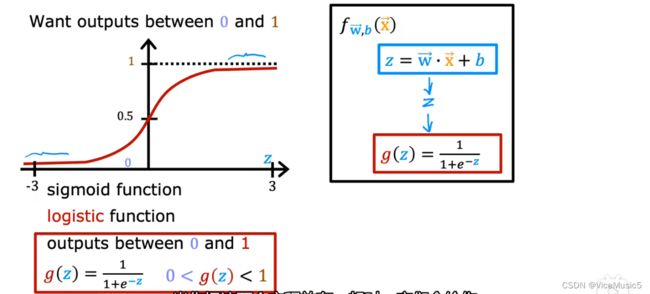
In this method , we induce a specialized function called ‘sigmoid’
![]()
![]()
In this situcation,z=wx+b
so,we can get ![]() and a new graph.
and a new graph.
sigmoid function is a very useful function,the curve line is naturally divdied into two parts by the point 0 and threshold 0.5.And the output is limited in 0 to 1.
The output of this model means the probability of "yes"(denote as f(x)=p(1),you must (记住) it!)
For example, If f(x)=0.99,we can say "It has 99% probability to judge a malignant tumor".Even if the yi(real situation) ,we still consider this prediction estimation reasonably.
Loss function:
In regression , we evaluate fitting dregees in one point by error function (yi'-yi)
For logistic regression ,error function is not a suitable function to count error or loss.There is a lot of local minima that you may get stuck.
So we induce a new notion : loss Function,to evaluate the sacle of loss in one point
(Notice: In the behind, f(x) is equals to g(z))
why we define this odd function? The answer is more reasonable
I set a example: when the real situation is "yes",but the f(x)->0
That means "We judge that it is absolutly a benign tumor,however, it is no",and Loss will pursue 1 according to this function, signfiting this fit operation is uncorrect.If you are interested in other situations,you can draw a graph or try in open lab.
If the prediction value settles near to real result, the loss will bacome small and reasonable.
Cost Function:
In linear regression ,we use error function to accumlate a cost value.Now we change it into loss function.
As the fact, The definition of loss cost function is equals to error function
![]()
![]()
so ,we can unfold it:
![]()
conventent to count? Maybe......
Gradient descend:
only need "simultaneous update"
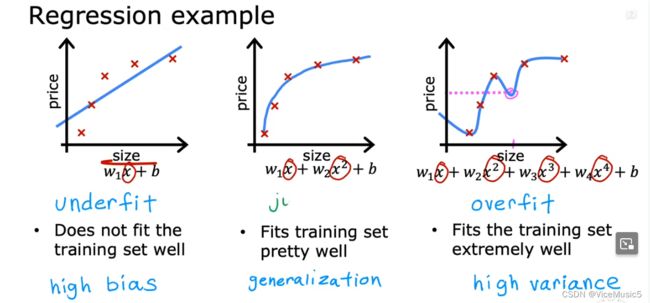
the scale of fit
so,there are there situation
1.Underfit: don't fit the training set wall
2.no name,no error
3.overfit:extremely well.....we don't think it is a good fitting
we focus on the 3-rd situation:
overtraining make a well but high varience。
we have three method to fix the overfit:
(1)collect more data to train a reasonable model
(2)only select main features(substract some feature)
(3)reduce the size of parameter
(3) is a usual method consist of some operation such as regularization, and penlize
regularization, and penlize
To make a model low variance, we must reduce some parameter.
The operation of reducing is "penlize", The entire process is regularization.
In fact,the method we used is called "L2 regularization".Its target is reducing the size of some parameter. "Penlize" is a technolegical term meaning a reduce paramter.
For example,If Iwant to reduce parameter w1,we can do this in iterating process.At the end of loss or error function,we add a item "![]() "
"
![]()
so in iterating function:![]() , this make a effensive cut in w1.
, this make a effensive cut in w1.
But in usual,we don't know what para should be penlized,so we decide to pandize all parameters.
At the end of loss or error function,we add a item
![]()
to maintain a proportional scale for each parameter."


