部分依赖图(Partial Dependence Plots)以及实战-疾病引起原因解释
接上篇,特征重要性解释
特征重要性展示了每个特征发挥的作用情况,partial dependence plots可以展示一个特征怎样影响的了预测结果。
前提同样是应用在模型建立完成后进行使用,概述如下:
-
首先选中一个样本数据,此时想观察Ball Possession列对结果的影响。
-
保证其他特征列不变,改变当前观察列的值,例如选择40%,50%,60%(大小)分别进行预测,得到各自的结果。
-
对比结果就能知道当前列(Ball Possession)对结果的影响情况。
-
包: pdpbox
单特征观察
from matplotlib import pyplot as plt
from pdpbox import pdp, get_dataset, info_plots

pdp_goals = pdp.pdp_isolate(model=my_model, dataset=val_X, model_features=feature_names, feature='Goal Scored')

pdp.pdp_plot(pdp_goals, 'Goal Scored')
plt.show()
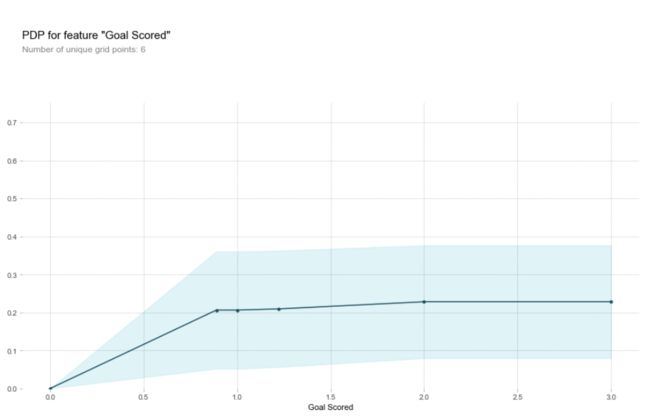
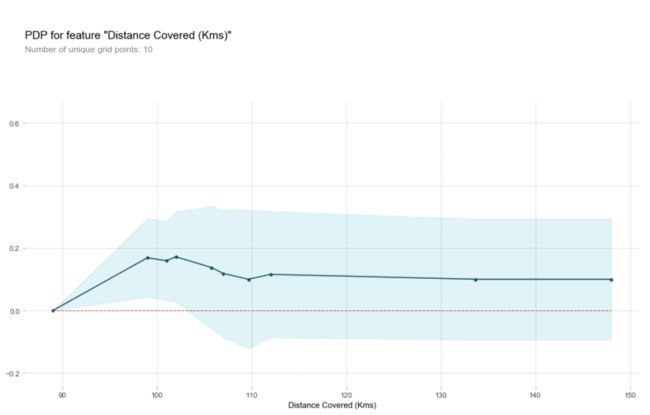
y轴表示预测结果的变化对比于基本模型,由于在观察时不可能只看一个样本数据,肯定要选择多个样本数据,蓝色区域表示的是置信度.
feature_to_plot = 'Distance Covered (Kms)'

rf_model = RandomForestClassifier(random_state=0).fit(train_X, train_y)

pdp_dist = pdp.pdp_isolate(model=rf_model, dataset=val_X, model_features=feature_names, feature=feature_to_plot)

pdp.pdp_plot(pdp_dist, feature_to_plot)
plt.show()
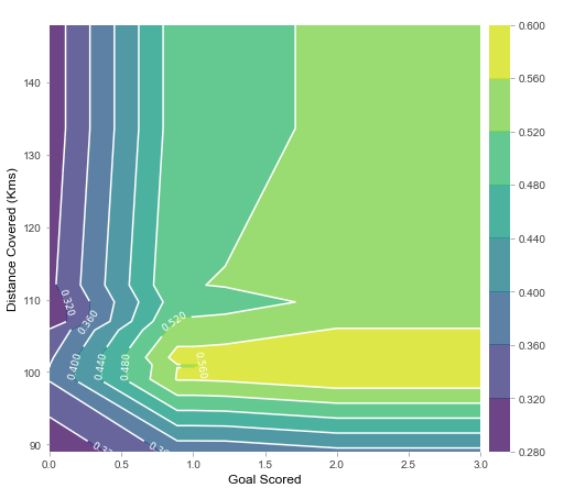
双特征观察
需要先改一下源码:将Anaconda3\Lib\site-packages\pdpbox 下pdp_plot_utils.py文件中contour_label_fontsize=fontsiz改成fontsize=fontsize
features_to_plot = ['Goal Scored', 'Distance Covered (Kms)']
inter1  =  pdp.pdp_interact(model=rf_model, dataset=val_X, model_features=feature_names, features=features_to_plot)

pdp.pdp_interact_plot(pdp_interact_out=inter1, feature_names=features_to_plot, plot_type='contour')
plt.show()
SHAP VALUES
可以直观的展示每一个特征对结果走势的影响
缺点:只传入一个样本点
row_to_show = 5
data_for_prediction = val_X.iloc[row_to_show]
data_for_prediction_array = data_for_prediction.values.reshape(1, -1)


my_model.predict_proba(data_for_prediction_array)
导入shap工具包可能出现问题,在Anaconda3/lib/site-packages/numpy/lib/arraypad.py中添加下面两个函数保存,重新加载即可,保存成utf-8
import shap

#实例化
explainer = shap.TreeExplainer(my_model)

#计算
shap_values = explainer.shap_values(data_for_prediction)
返回的SHAP values中包括了negative和positive两种情况,通常选择一种(positive)即可
shap.initjs()
shap.force_plot(explainer.expected_value[1], shap_values[1], data_for_prediction)
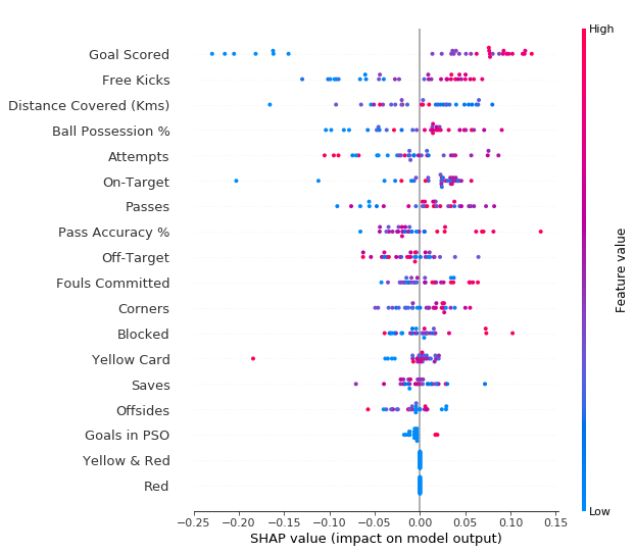
Summary Plots
explainer = shap.TreeExplainer(my_model)

shap_values = explainer.shap_values(val_X)

shap.summary_plot(shap_values[1], val_X)
实战-疾病引起原因模型解释
疾病引起原因模型解释
import numpy as np
import pandas as pd
import matplotlib.pyplot as plt
import seaborn as sns
from sklearn.ensemble import RandomForestClassifier
from sklearn.tree import DecisionTreeClassifier
from sklearn.tree import export_graphviz
from sklearn.metrics import roc_curve, auc
from sklearn.metrics import classification_report
from sklearn.metrics import confusion_matrix
from sklearn.model_selection import train_test_split
import eli5
from eli5.sklearn import PermutationImportance
import shap
from pdpbox import pdp, info_plots
np.random.seed(123)

pd.options.mode.chained_assignment = None

dt = pd.read_csv("heart.csv")
dt.head()
- age:该人的年龄
- sex:该人的性别(1 =男性,0 =女性)
- cp:胸痛经历(值1:典型心绞痛,值2:非典型心绞痛,值3:非心绞痛,值4:无症状)
- trestbps:该人的静息血压(入院时为mm Hg)
- chol:人体胆固醇测量单位为mg / dl
- fbs:该人的空腹血糖(> 120 mg / dl,1 = true; 0 = false)
- restecg:静息心电图测量(0 =正常,1 =有ST-T波异常,2 =按Estes标准显示可能或明确的左心室肥厚)
- thalach:达到了该人的最大心率
- exang:运动诱发心绞痛(1 =是; 0 =否)
- oldpeak:运动相对于休息引起的ST段压低('ST’与ECG图上的位置有关。点击此处查看更多内容)
- slope:峰值运动ST段的斜率(值1:上升,值2:平坦,值3:下降)
- ca:主要数量(0-3)
- thal:称为地中海贫血的血液疾病(3 =正常; 6 =固定缺陷; 7 =可逆缺陷)
- target:心脏病(0 =不,1 =是)
dt.columns = ['age', 'sex', 'chest_pain_type', 'resting_blood_pressure', 'cholesterol', 'fasting_blood_sugar', 'rest_ecg', 'max_heart_rate_achieved',
       'exercise_induced_angina', 'st_depression', 'st_slope', 'num_major_vessels', 'thalassemia', 'target']

dt['sex'][dt['sex'] == 0] = 'female'
dt['sex'][dt['sex'] == 1] = 'male'

dt['chest_pain_type'][dt['chest_pain_type'] == 1] = 'typical angina'
dt['chest_pain_type'][dt['chest_pain_type'] == 2] = 'atypical angina'
dt['chest_pain_type'][dt['chest_pain_type'] == 3] = 'non-anginal pain'
dt['chest_pain_type'][dt['chest_pain_type'] == 4] = 'asymptomatic'

dt['fasting_blood_sugar'][dt['fasting_blood_sugar'] == 0] = 'lower than 120mg/ml'
dt['fasting_blood_sugar'][dt['fasting_blood_sugar'] == 1] = 'greater than 120mg/ml'

dt['rest_ecg'][dt['rest_ecg'] == 0] = 'normal'
dt['rest_ecg'][dt['rest_ecg'] == 1] = 'ST-T wave abnormality'
dt['rest_ecg'][dt['rest_ecg'] == 2] = 'left ventricular hypertrophy'

dt['exercise_induced_angina'][dt['exercise_induced_angina'] == 0] = 'no'
dt['exercise_induced_angina'][dt['exercise_induced_angina'] == 1] = 'yes'

dt['st_slope'][dt['st_slope'] == 1] = 'upsloping'
dt['st_slope'][dt['st_slope'] == 2] = 'flat'
dt['st_slope'][dt['st_slope'] == 3] = 'downsloping'

dt['thalassemia'][dt['thalassemia'] == 1] = 'normal'
dt['thalassemia'][dt['thalassemia'] == 2] = 'fixed defect'
dt['thalassemia'][dt['thalassemia'] == 3] = 'reversable defect'

dt.dtypes

dt['sex'] = dt['sex'].astype('object')
dt['chest_pain_type'] = dt['chest_pain_type'].astype('object')
dt['fasting_blood_sugar'] = dt['fasting_blood_sugar'].astype('object')
dt['rest_ecg'] = dt['rest_ecg'].astype('object')
dt['exercise_induced_angina'] = dt['exercise_induced_angina'].astype('object')
dt['st_slope'] = dt['st_slope'].astype('object')
dt['thalassemia'] = dt['thalassemia'].astype('object')

dt = pd.get_dummies(dt, drop_first=True)
dt.head()

X_train, X_test, y_train, y_test = train_test_split(dt.drop('target', 1), dt['target'], test_size = .2, random_state=10)

model = RandomForestClassifier(max_depth=5)
model.fit(X_train, y_train)

estimator = model.estimators_[1]
feature_names = [i for i in X_train.columns]

y_train_str = y_train.astype('str')
y_train_str[y_train_str == '0'] = 'no disease'
y_train_str[y_train_str == '1'] = 'disease'
y_train_str = y_train_str.values

export_graphviz(estimator, out_file='tree.dot',
                feature_names = feature_names,
                class_names = y_train_str,
                rounded = True, proportion = True,
                label='root',
                precision = 2, filled = True)


from subprocess import call
call(['dot', '-Tpng', 'tree.dot', '-o', 'tree.png', '-Gdpi=600'])

from IPython.display import Image
Image(filename = 'tree.png')
y_predict = model.predict(X_test)
y_pred_quant = model.predict_proba(X_test)[:, 1]
y_pred_bin = model.predict(X_test)

confusion_matrix = confusion_matrix(y_test, y_pred_bin)
confusion_matrix
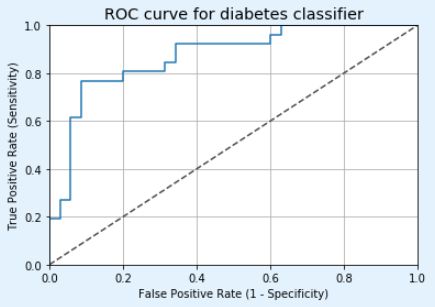
fpr, tpr, thresholds = roc_curve(y_test, y_pred_quant)

fig, ax = plt.subplots()
ax.plot(fpr, tpr)
ax.plot([0, 1], [0, 1], transform=ax.transAxes, ls="--", c=".3")
plt.xlim([0.0, 1.0])
plt.ylim([0.0, 1.0])
plt.rcParams['font.size'] = 12
plt.title('ROC curve for diabetes classifier')
plt.xlabel('False Positive Rate (1 - Specificity)')
plt.ylabel('True Positive Rate (Sensitivity)')
plt.grid(True)
plt.show()
auc(fpr, tpr)
perm = PermutationImportance(model, random_state=1).fit(X_test, y_test)
eli5.show_weights(perm, feature_names = X_test.columns.tolist())
base_features = dt.columns.values.tolist()
base_features.remove('target')

feat_name = 'num_major_vessels'
pdp_dist = pdp.pdp_isolate(model=model, dataset=X_test, model_features=base_features, feature=feat_name)

pdp.pdp_plot(pdp_dist, feat_name)
plt.show()
feat_name = 'age'
pdp_dist = pdp.pdp_isolate(model=model, dataset=X_test, model_features=base_features, feature=feat_name)

pdp.pdp_plot(pdp_dist, feat_name)
plt.show()

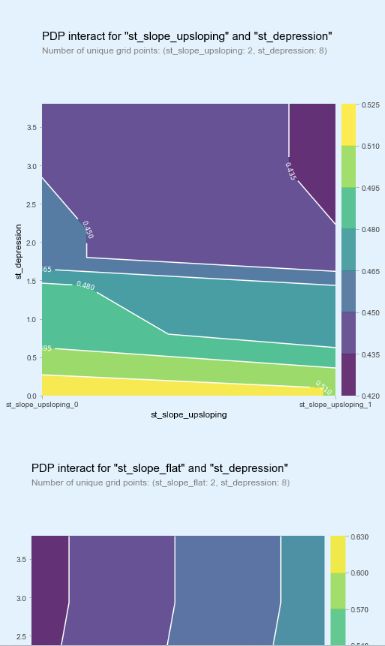
inter1  =  pdp.pdp_interact(model=model, dataset=X_test, model_features=base_features, features=['st_slope_upsloping', 'st_depression'])

pdp.pdp_interact_plot(pdp_interact_out=inter1, feature_names=['st_slope_upsloping', 'st_depression'], plot_type='contour')
plt.show()

inter1  =  pdp.pdp_interact(model=model, dataset=X_test, model_features=base_features, features=['st_slope_flat', 'st_depression'])

pdp.pdp_interact_plot(pdp_interact_out=inter1, feature_names=['st_slope_flat', 'st_depression'], plot_type='contour')
plt.show()
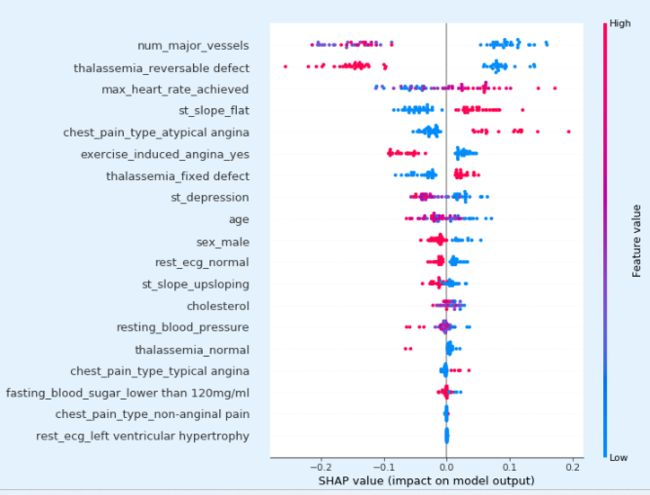
explainer = shap.TreeExplainer(model)
shap_values = explainer.shap_values(X_test)
shap.summary_plot(shap_values[1], X_test)
def heart_disease_risk_factors(model, patient):

    explainer = shap.TreeExplainer(model)
    shap_values = explainer.shap_values(patient)
    shap.initjs()
    return shap.force_plot(explainer.expected_value[1], shap_values[1], patient)

data_for_prediction = X_test.iloc[1,:].astype(float)
heart_disease_risk_factors(model, data_for_prediction)
