2021-04-21
python 画多列柱状图/柱状图子图
一、目的
使用matplotlib画柱状图,或在子图中画柱状图
二、方法
1. 导包
import pandas as pd
import numpy as np
import matplotlib.pyplot as plt
%matplotlib inline

plt.rcParams['font.sans-serif']=['SimHei'] #用来正常显示中文标签
plt.rcParams['axes.unicode_minus']=False #用来正常显示负号
# ‘SimHei’ : 中文黑体
# ‘Kaiti’ : 中文楷体
# ‘LiSu’ : 中文隶书
# ‘FangSong’ : 中文仿宋
# ‘YouYuan’ : 中文幼圆
# ‘STSong’ : 华文宋体
2、函数(将画图方法封装为函数)
def create_multi_bars(labels, datas, title, bar_names, tick_step=1, group_gap=0.2, bar_gap=0, subplot=False):
    '''
    labels : x轴坐标标签序列
    datas :数据集,二维列表,要求列表每个元素的长度必须与labels的长度一致
    title: 图标题
    bar_names :图例, 等于data的元素个数
    tick_step :默认x轴刻度步长为1,通过tick_step可调整x轴刻度步长。
    group_gap : 柱子组与组之间的间隙,最好为正值,否则组与组之间重叠
    bar_gap :每组柱子之间的空隙,默认为0,每组柱子紧挨,正值每组柱子之间有间隙,负值每组柱子之间重叠
    subplot: 是否使用子图, 建议使用列表形式
    '''
    if subplot:
        # 子图的方式画图
        if type(subplot) == str or type(subplot) == list:
            nrows = int(subplot[0])
            ncols = int(subplot[1])
            index = int(subplot[2])

            plt.subplot(nrows, ncols, index)

    # ticks为x轴刻度
    ticks = np.arange(len(labels)) * tick_step
    # group_num为数据的组数,即每组柱子的柱子个数
    group_num = len(datas)
    # group_width为每组柱子的总宽度,group_gap 为柱子组与组之间的间隙。
    group_width = tick_step - group_gap
    # bar_span为每组柱子之间在x轴上的距离,即柱子宽度和间隙的总和
    bar_span = group_width / group_num
    # bar_width为每个柱子的实际宽度
    bar_width = bar_span - bar_gap
    # baseline_x为每组柱子第一个柱子的基准x轴位置,随后的柱子依次递增bar_span即可
    baseline_x = ticks - (group_width - bar_span) / 2
    for index, y in enumerate(datas):
        plt.bar(baseline_x + index*bar_span, y, bar_width, label=bar_names[index])
    plt.ylabel('Scores')
    plt.xlabel('Quarter')
    plt.title(title)
    # x轴刻度标签位置与x轴刻度一致
    plt.xticks(ticks, labels)
    plt.legend(loc='upper left')
    # plt.legend(loc='middle')
函数中的一些概念
3、画单个图
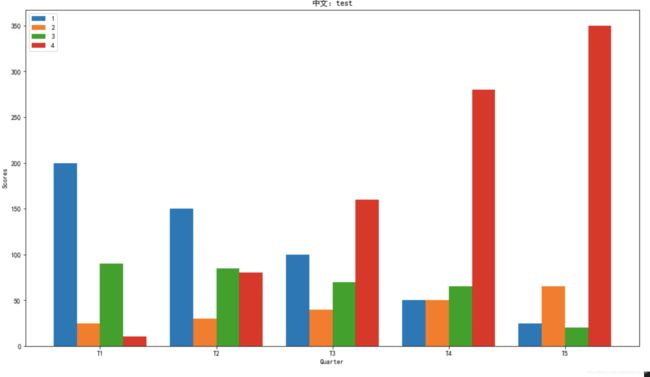
label = ['T1', 'T2', 'T3', 'T4', 'T5']
first = [200, 150, 100, 50, 25]
second = [25, 30, 40, 50, 65]
third = [90, 85, 70, 65, 20]
fourth = [10, 80, 160, 280, 350]
data = [first, second, third, fourth]
title = '中文:test'
bar_names = [1, 2, 3, 4]

# 设置画布大小
plt.figure(figsize=(16, 9))
create_multi_bars(label, data, title=title, bar_names=bar_names,bar_gap=0)
# 在画布上画图
plt.show()
结果:
4、子图
label = ['T1', 'T2', 'T3', 'T4', 'T5']
first = [200, 150, 100, 50, 25]
second = [25, 30, 40, 50, 65]
third = [90, 85, 70, 65, 20]
fourth = [10, 80, 160, 280, 350]
data = [first, second, third, fourth]
title = '中文:test'
bar_names = [1, 2, 3, 4]


plt.figure(figsize=(25, 15))
for i in range(12):
    items = [3, 4, i + 1]
    create_multi_bars(label, data, title=title, bar_names=bar_names,bar_gap=0, subplot=items)

plt.show()
结果
三、参考
https://zhuxianfei.com/python/45280.html
四、pandas画多列柱状图
pandas画多列柱状图十分简单,pandas画多列柱状子图待研究
1. 数据形式
import numpy as np
import pandas as pd

df = pd.DataFrame(abs(np.random.randn(10,5)),columns=['A','B','C','D','E'],index = np.arange(0,100,10))
print(df.shape)
df.head()
2. 画图
df.plot(kind='bar', figsize=(12, 6), title='这是一张基本柱状图')
plt.show()


