010:连续跌3天,同时这三天收盘价都在20日均线下,第四天上涨的概率--以京泉华为例
对于《连续跌三天,压第四天上涨的盈利计算》,我们可以继续优化这个策略,增加条件:同时三天都收盘在20日均线下。
因为我们上一篇《获取20日均线数据到excel表中》获得了20日均线数据,我们可以利用均线数据来编写新的脚本。这里我们用$京泉华(SZ002885)$为例子。
步骤:
1,用《根据股票代码和起始日期获取K线数据到excel表》的脚本获取京泉华最近大约三年的K线数据,得到文件《002885.csv》
2,用《获取20日均线数据到excel表中》的脚本获取到文件《avg_20_002885.csv》
3,最后用以下脚本(名为:three_day_green_20_low.py)来获取最终的结果:
import tkinter as tk
from tkinter import filedialog
import pandas as pd
path=''
benjin = 10000.00
def open_file():
global path
path = filedialog.askopenfilename(initialdir="./", title="Select file", filetypes=(("Text files", "*"), ("All files", "*.*")))
print("Selected file:", path)
root.quit() # 选择完文件后退出主循环
root = tk.Tk()
root.title("File Selector")
button = tk.Button(root, text="Open File", command=open_file)
button.pack()
root.mainloop()
# 读取表格数据
data = pd.read_csv(path, delimiter=',')
# 初始化计数器
total_count = 0
old_count = 0
up_count = 0
sum = 0
# 遍历数据
for i in range(len(data)-3):
if(i<20):
continue
# 判断是否连续三天下跌
if data['涨跌幅'][i] < 0 and data['涨跌幅'][i+1] < 0 and data['涨跌幅'][i+2] < 0:
old_count += 1
if data['收盘'][i] < data["20日均线"][i] and data['收盘'][i+1] < data["20日均线"][i+1] and data['收盘'][i+2] < data["20日均线"][i+2] :
total_count += 1
if(i+4 0:
up_count += 1
# 计算概率
probability = up_count / total_count
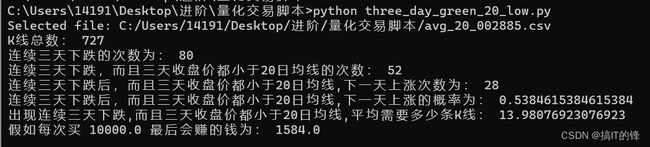
print("K线总数:",len(data))
print("连续三天下跌的次数为:", old_count)
print("连续三天下跌,而且三天收盘价都小于20日均线的次数:", total_count)
print("连续三天下跌后,而且三天收盘价都小于20日均线,下一天上涨次数为:", up_count)
print("连续三天下跌后,而且三天收盘价都小于20日均线,下一天上涨的概率为:", probability)
print("出现连续三天下跌,而且三天收盘价都小于20日均线,平均需要多少条K线:" , len(data)/total_count)
print("假如每次买",benjin,"最后会赚的钱为:",sum)
执行后,选择文《avg_20_002885.csv》:
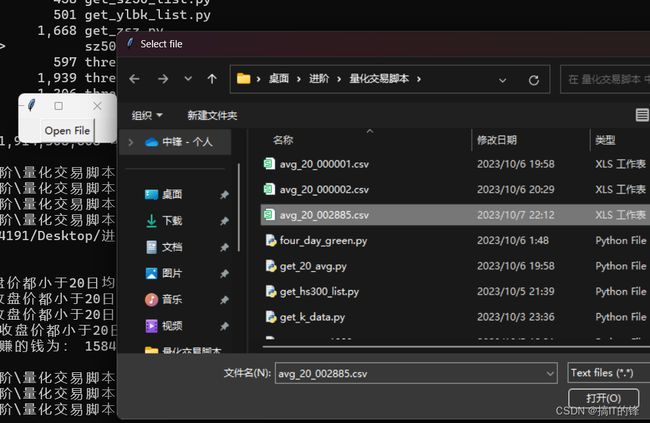
打开,然后看结果:
可以多统计不同的个股,找到一些相对合适的标的。