【机器学习】项目数据处理部分
文章目录
- 前言
- 项目理解
- 数据探索
- 特征工程
- 总结
前言
本文参考《阿里云天池大赛赛题解析》,拿到一个项目或者赛题,使用机器学习来进行预测分类,需要以下七个步骤:
- 项目(赛题)理解
- 数据探索
- 特征工程
- 模型训练
- 模型验证
- 特征优化
- 模型融合
本本是数据处理,即前3个步骤:项目理解、数据探索,特征工程。
项目理解
简单的了解一下,并不太重要的一个步骤。
- 知道项目是干什么的,了解一下项目业务。
- 是什么类型的模型,是分类还是回归?可以提前罗列出一些可以用于该模型的机器学习的算法。
数据探索
- 需要导入的库:基础库和画图工具
import numpy as np
import pandas as pd
import matplotlib.pyplot as plt
import seaborn as sns

from scipy import stats

import warnings
warnings.filterwarnings("ignore")
- 读取数据文件
train_data_file = "./zhengqi_train.txt"
test_data_file =  "./zhengqi_test.txt"

train_data = pd.read_csv(train_data_file, sep='\t', encoding='utf-8')
test_data = pd.read_csv(test_data_file, sep='\t', encoding='utf-8')
sep是分隔符,根据文件数据用pandas读取。
- 查看数据基本信息的方法:
1)head():查看前五行数据。
2)info():整体数据的基本信息,包括每一列有多少数据,是什么数据类型等。
3)describe():查看数据的统计信息。
4)value_counts():查看标签有几类,每一类有多少数据
5)groupby('索引名').size():查看该索引有几类,每一类有多少数据
到这里你需要知道:
1)特征与标签在数据中的位置。
2)特征中有那些是 数字型数据和字符型数据,以及那些是连续型变量和类别型变量。
- 可视化数据分布【单变量】
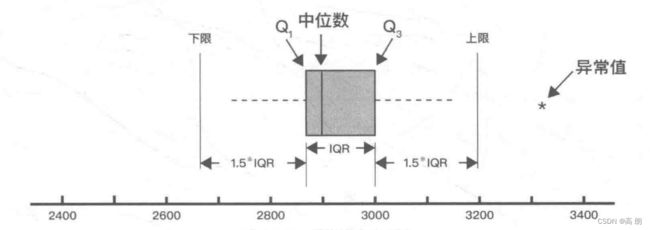
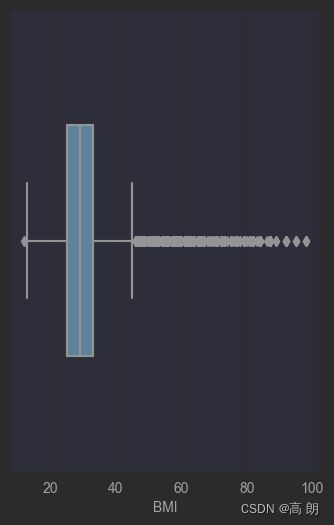
1)【箱型图】连续型变量:用来识别异常值,在上限与下线之外的点是异常值
单个变量的箱型图:
fig = plt.figure(figsize=(4, 6))  # 指定绘图对象宽度和高度
sns.boxplot(数据集['索引名'],orient="v", width=0.5)
# 画箱式图
column = train_data.columns.tolist()[1:]  # 列表头 数据集
fig = plt.figure(figsize=(20, 40))  # 指定绘图对象宽度和高度
for i in range(多少个图):
    plt.subplot(10, 3, i + 1)  # 10行3列 可画30子图
    sns.boxplot(x = train_data[column[i]], orient="v", width=0.5)  # 箱式图
    plt.ylabel(column[i], fontsize=8)
plt.show()
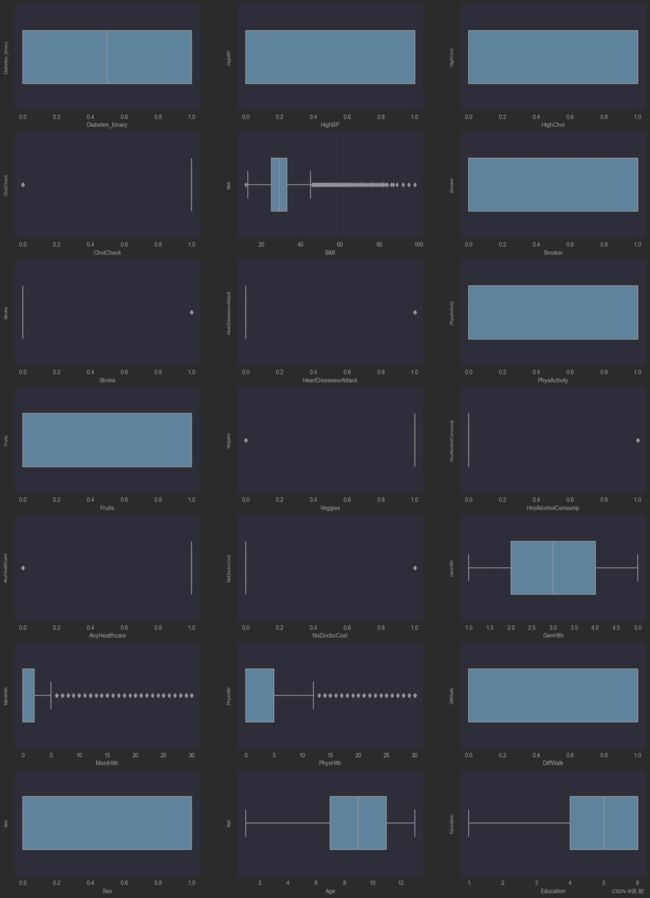 可以看到有异常值,这个异常值只是对影响的特殊数据点的进行检查,它的选择取决于对业务的理解。
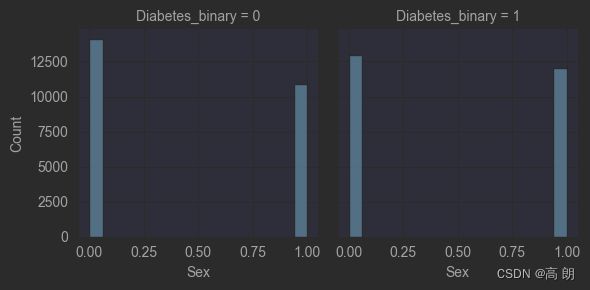
2)【柱状图】分类型数据可以通过柱状图来表示:
g = sns.FacetGrid(train_data, col='Diabetes_binary')
g = g.map(sns.histplot, "Sex")
plt.show()
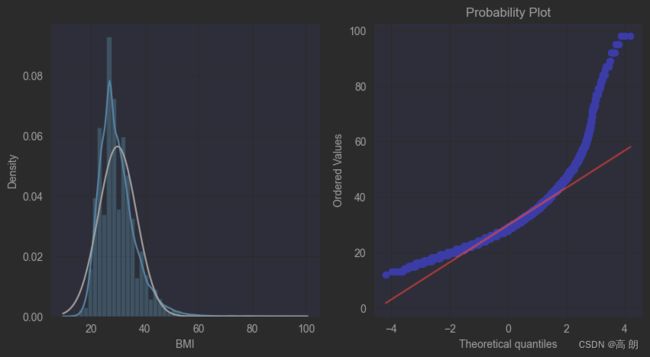
3)【直方图和Q-Q图】
QQ图是指数据的分位数对比参照的图,如果数据符合正态分布,则所有的点都会落在直线上。
plt.figure(figsize=(10,5))

ax=plt.subplot(1,2,1)
sns.distplot(train_data['BMI'],fit=stats.norm)
ax=plt.subplot(1,2,2)
res = stats.probplot(train_data['BMI'], plot=plt)
train_cols = 6
train_rows = len(train_data.columns)
plt.figure(figsize=(4*train_cols,4*train_rows))

i=0
for col in train_data.columns:
    i+=1
    ax=plt.subplot(train_rows,train_cols,i)
    sns.distplot(train_data[col],fit=stats.norm)

    i+=1
    ax=plt.subplot(train_rows,train_cols,i)
    res = stats.probplot(train_data[col], plot=plt)
plt.show()
4)【KDE分布图】
训练集数据和测试集数据的分布情况,查看数据分布是否一致
dist_cols = 6
dist_rows = len(test_data.iloc[:,1:].columns)

plt.figure(figsize=(4*dist_cols,4*dist_rows))

i=1
for col in test_data.iloc[:,1:].columns:
    ax=plt.subplot(dist_rows,dist_cols,i)
    ax = sns.kdeplot(train_data[col], color="Red", shade=True)
    ax = sns.kdeplot(test_data[col], color="Blue", shade=True)
    ax.set_xlabel(col)
    ax.set_ylabel("Frequency")
    ax = ax.legend(["train","test"])

    i+=1
plt.show()
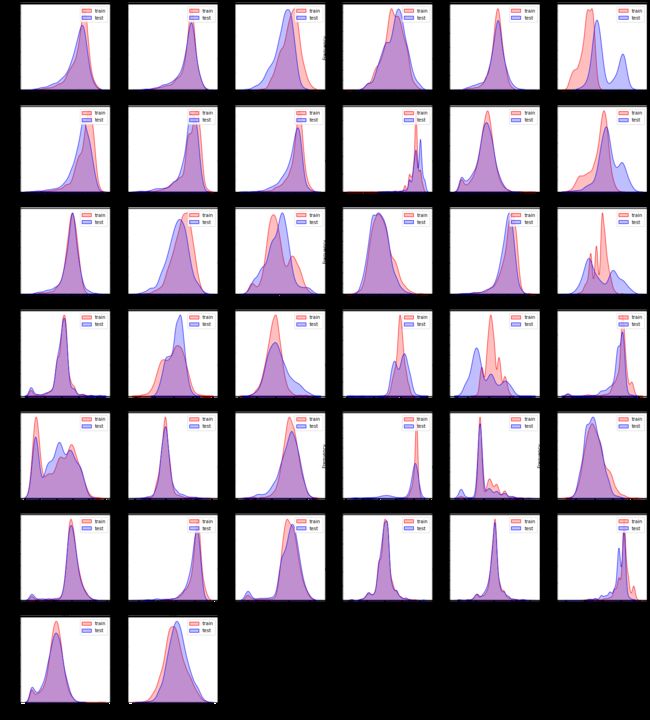 有一些特征数据不太一致,就得去掉,很有可能是噪声,影响预测结果。
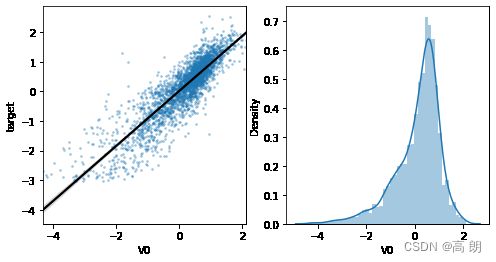
5)【线性回归关系图】
主要用于分析变量之间的线性回归关系:
单个特征与标签的线性关系:
fcols = 2
frows = 1

plt.figure(figsize=(8,4))

ax=plt.subplot(1,2,1)
sns.regplot(x='V0', y='target', data=train_data, ax=ax,
            scatter_kws={'marker':'.','s':3,'alpha':0.3},
            line_kws={'color':'k'});
plt.xlabel('V0')
plt.ylabel('target')

ax=plt.subplot(1,2,2)
sns.distplot(train_data['V0'].dropna())
plt.xlabel('V0')

plt.show()
fcols = 6
frows = len(test_data.columns)
plt.figure(figsize=(5*fcols,4*frows))

i=0
for col in test_data.columns:
    i+=1
    ax=plt.subplot(frows,fcols,i)
    sns.regplot(x=col, y='target', data=train_data, ax=ax,
                scatter_kws={'marker':'.','s':3,'alpha':0.3},
                line_kws={'color':'k'});
    plt.xlabel(col)
    plt.ylabel('target')

    i+=1
    ax=plt.subplot(frows,fcols,i)
    sns.distplot(train_data[col].dropna())
    plt.xlabel(col)
6)【多变量图】可以支持各种类型的变量分析,是特征分析很好用的工具
sns.pairplot(train_data.iloc[:,1], hue = 'Diabetes_binary')
- 可视化数据分布【双变量】
特征变量和目标变量及特征变量之间的关系:
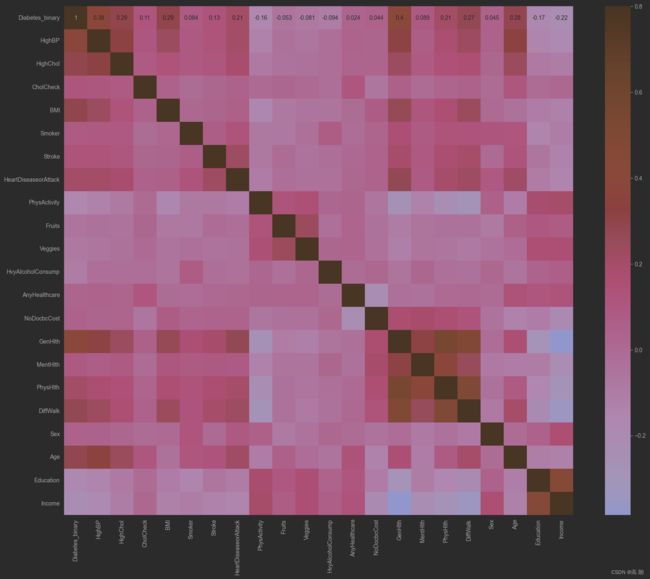
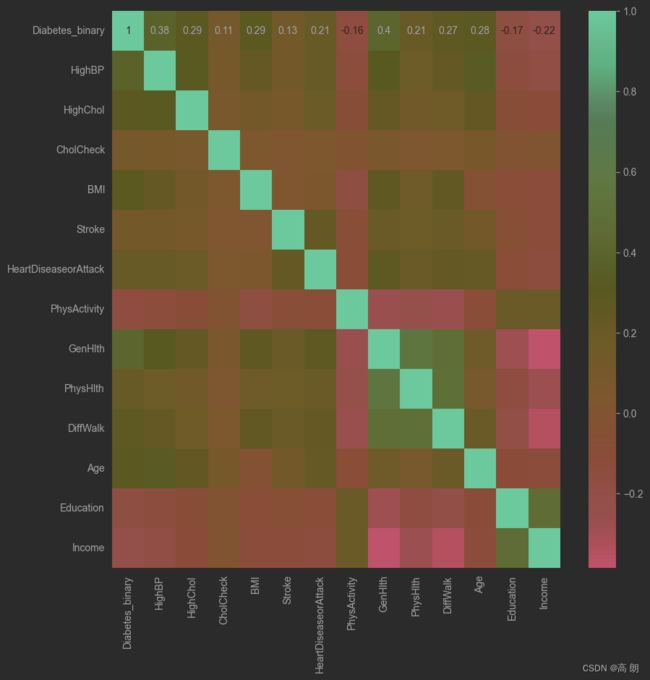
热力图:
train_corr = train_data.iloc[:,1:].corr()
# 画出相关性热力图
ax = plt.subplots(figsize=(20, 16))#调整画布大小
ax = sns.heatmap(train_corr, vmax=.8, square=True, annot=True)#画热力图   annot=True 显示系数
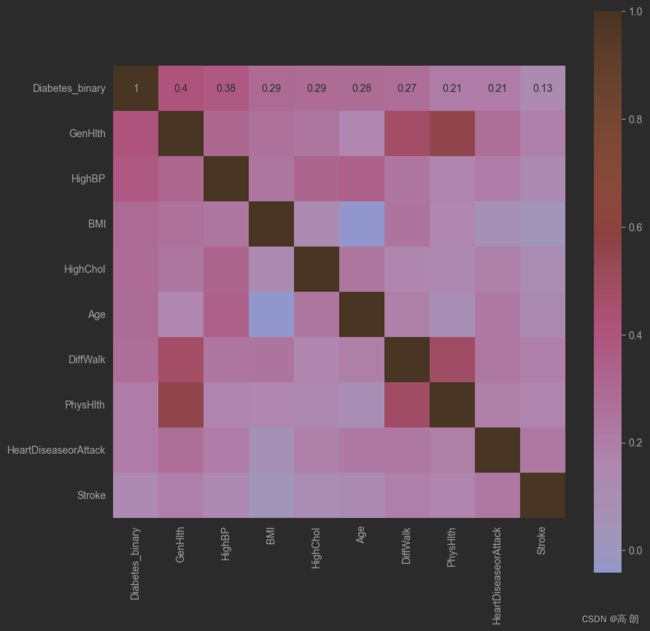
#寻找K个最相关的特征信息
k = 10 # number of variables for heatmap
cols = train_corr.nlargest(k, 'Diabetes_binary')['Diabetes_binary'].index

cm = np.corrcoef(train_data[cols].values.T)
hm = plt.subplots(figsize=(10, 10))#调整画布大小
#hm = sns.heatmap(cm, cbar=True, annot=True, square=True)
#g = sns.heatmap(train_data[cols].corr(),annot=True,square=True,cmap="RdYlGn")
hm = sns.heatmap(train_data[cols].corr(),annot=True,square=True)

plt.show()
threshold = 0.1

corrmat = train_data.iloc[:,1:].corr()
top_corr_features = corrmat.index[abs(corrmat["Diabetes_binary"])>threshold]
plt.figure(figsize=(10,10))
g = sns.heatmap(train_data[top_corr_features].corr(),annot=True,cmap="RdYlGn")
可以直接用相关系数阈值来移除某些特征
# Threshold for removing correlated variables
threshold = 0.5

# Absolute value correlation matrix
corr_matrix = data_train1.corr().abs()
drop_col=corr_matrix[corr_matrix["target"]<threshold].index
data_all.drop(drop_col, axis=1, inplace=True)
- Box-Cox变换
线性回归基于正态分布,需要将数据转换使其符合正态分布。
# 1. 将训练集和测试集的特征变量合并 一起处理
train_x =  train_data.drop(['Diabetes_binary'], axis=1) # 训练集删除标签

#data_all=pd.concat([train_data,test_data],axis=0,ignore_index=True)
data_all = pd.concat([train_x,test_data]) # 合并训练集和测试集

#View data
data_all.head()

# 2. 归一化操作
# normalise numeric columns
cols_numeric=list(data_all.columns)

def scale_minmax(col):
    return (col-col.min())/(col.max()-col.min())

data_all[cols_numeric] = data_all[cols_numeric].apply(scale_minmax,axis=0)
data_all[cols_numeric].describe().T # 查看
特征工程
特征工程就是从原始数据提取特征的过程,这些特征可以很好的描述数据,并且利用特征建立的模型在未知数据上的性能表现可以达到最优。包括:特征使用、特征获取、特征处理、特征选择和特征监控。
处理流程:
- 去掉无用特征
- 去除冗余特征
- 对特征进行转换(数值化、归一化、类型转换)
- 对特征进行处理(异常值、最大值、最小值、缺失值)
- 符合模型的使用
总体可以分为:数据预处理、特征处理、特征选择。
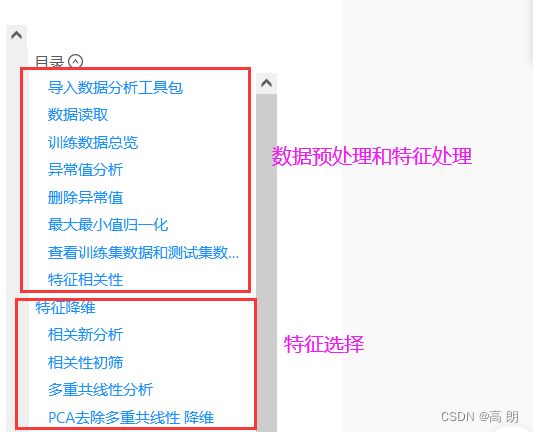
数据预处理和特征处理:【机器学习】sklearn对数据预处理
(补用随机森林填补缺失值:【机器学习】集成学习(以随机森林为例))
特征选择:【机器学习】sklearn特征选择(feature selection)
总结
- 通过数据探索可视化:
- 找出异常值并进行处理,一些不符合常理的值,视业务逻辑而定。
- 缺失值的处理,缺失很少的可以直接删除,其他的填均值、中位数、众数,或者使用逻辑森林来进行缺失值的填充
- 数据处理:连续性(二值化与分段),分类型(编码与哑变量)
具体参考:
- 【机器学习】sklearn对数据预处理
- 【机器学习】集成学习(以随机森林为例) (看随机森林填充缺失值部分)
- 特征选择
- 通过特征相关性,热力图,直接选择一些相关性较高的特征或者删除相关性不高的特征。
- 过滤法,嵌入法,包装法来进行特征选择
- 降维算法来达到特征选择的目的
具体参考:
- 本文中数据探索部分热力图
- 【机器学习】sklearn特征选择(feature selection)(过滤法,嵌入法,包装法)
- 【机器学习】sklearn降维算法PCA
