python基础------绘制条形图、直方图、饼图、热力图、极坐标图、进度条
1.绘制直方图
plt.hist()
各种参数含义
data:必选参数,绘图数据
bins:直方图长条数目,默认10
facecolor:长条形的颜色
edgecolor:长条形边框颜色
alpha:透明度
nprmed:是否将得到的图归一化,默认为0(代表不归一化);为1时为归一化。
import matplotlib.pyplot as plt
import numpy as np
import matplotlib.pylab as plb

#设置中文字体
plt.rcParams['font.sans-serif']=['Simhei']
# 显示符号
plt.rcParams['axes.unicode_minus']=False

data=np.random.randn(10000)
plt.hist(data,bins=20,facecolor='blue',normed=0,alpha=0.5,edgecolor='red')
plt.xlabel('区间')
plt.ylabel('频数/频率')
plt.title('频数、频率分布直方图')
plt.show()
2.条形图
2.1绘制条形图(与水平轴平行)
import matplotlib.pyplot as plt
import numpy as np

#设置中文字体
plt.rcParams['font.sans-serif']=['Simhei']
# 显示符号
plt.rcParams['axes.unicode_minus']=False
x=np.arange(1,6)
y=np.arange(3,8)
plt.barh(x,y)
plt.show()
2.2绘制一个数据样本的条形图(与水平轴垂直)
import matplotlib.pyplot as plt
import numpy as np

#设置中文字体
plt.rcParams['font.sans-serif']=['Simhei']
# 显示符号
plt.rcParams['axes.unicode_minus']=False

n=12
x=np.arange(n)
y1=(1-x/float(n))*np.random.uniform(0.5,1.0,n)
y2=(1-x/float(n))*np.random.uniform(0.5,1.0,n)
plb.bar(x, y1, facecolor='red', edgecolor='white')
plb.bar(x, -y2, facecolor='yellow', edgecolor='white')

for x,y in zip(x, y1):
    plb.text(x, y+0.05, '%.2f' % y, ha='center', va='bottom')

for x, y in zip(x, -y2):
    plb.text(x, y-0.15,' {:.2f}'.format(y), ha='center', va='bottom')

#{:.2f}'.format(y)
plb.ylim(-1.25,1.25)
plb.show()
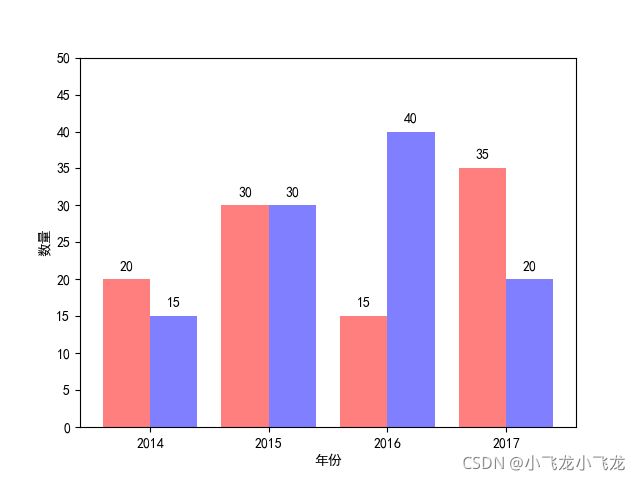
2.3绘制多个数据进行对比的条形图(与水平轴垂直)
import matplotlib.pyplot as plt
import numpy as np

#设置中文字体
plt.rcParams['font.sans-serif']=['Simhei']
# 显示符号
plt.rcParams['axes.unicode_minus']=False
label_list=['2014','2015','2016','2017']
num_list1=[20,30,15,35]
num_list2=[15,30,40,20]
x=range(len(num_list1))
print(x)

#设置x轴属性
plt.xticks([index+0.2 for index in x],label_list)
plt.xlabel('年份')
#设置y轴属性
plt.ylim(0, 50)
plt.yticks(np.linspace(0,50,11))
plt.ylabel('数量')

# 绘制条形图
a1=plt.bar(x,height=num_list1,width=0.4,color='red',alpha=0.5)
a2=plt.bar([i+0.4 for i in x],height=num_list2,width=0.4,color='blue',alpha=0.5)

for i in a1:
    height=i.get_height()
    plt.text(i.get_x()+i.get_width()/2,height+1,str(height),ha='center', va='bottom')

for j in a2:
    height=j.get_height()
    plt.text(j.get_x()+j.get_width()/2,height+1,str(height),ha='center', va='bottom')

plt.show()
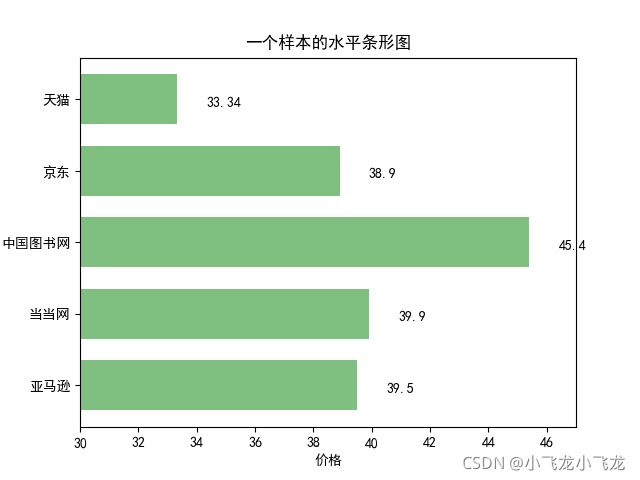
2.4绘制一个样本的水平条形图
import matplotlib.pyplot as plt
import numpy as np

price=[39.5,39.9,45.4,38.9,33.34]
plt.xlim(30,47)
plt.xticks(np.linspace(30,46,9))
plt.xlabel('价格')
plt.yticks(range(5), ['亚马逊','当当网','中国图书网','京东','天猫'])

plt.barh(range(5),price,height=0.7,color='green',alpha=0.5)
plt.title('不同平台图书价格')
for x,y in enumerate(price):
    plt.text(y+1,x-0.1,'%s'%y)
plt.title('一个样本的水平条形图')
plt.show()
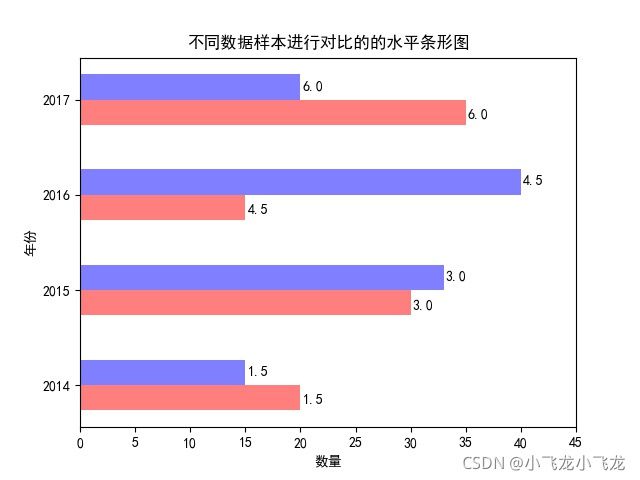
2.5绘制不同数据样本进行对比的的水平条形图
import matplotlib.pyplot as plt
import numpy as np

plt.xlim(0,45)
plt.xticks(np.linspace(0,45,10))
label_list=['2014','2015','2016','2017']
num_list1=[15,33,40,20]
num_list2=[20,30,15,35]
y=range(1,len(num_list1)+1)
y=[index*1.5 for index in y]
plt.barh(y,num_list1,height=0.4,color='blue',alpha=0.5)
plt.barh([i-0.4 for i in y],num_list2,height=0.4,color='red',alpha=0.5)
plt.yticks([i-0.2 for i in y],label_list)
for x,y1 in zip(num_list1,y):
    plt.text(x+0.2,y1-0.05,'%s'%y1)
for x,y2 in zip(num_list2,y):
    plt.text(x+0.2,y2-0.5,'%s'%y2)

plt.xlabel('数量')
plt.ylabel('年份')
plt.title('不同数据样本进行对比的的水平条形图')
plt.savefig('b.jpg')
plt.show()
2.6绘制堆叠条形图
import matplotlib.pyplot as plt
import numpy as np

y1=[52,69,58,12,39,75]
y2=[56,15,84,65,45,48]

x=[i for i in range(len(y1))]
plt.bar(x,height=y1,width=0.3,color='blue',label='x',alpha=0.5)
plt.bar(x,height=y2,width=0.3,color='gold',label='y',alpha=0.8)
plt.legend(loc='upper left')

plt.xlabel('x')
plt.ylabel('y1/y2')
plt.title('堆叠条形图',fontsize=12,c='gray')
plt.show()
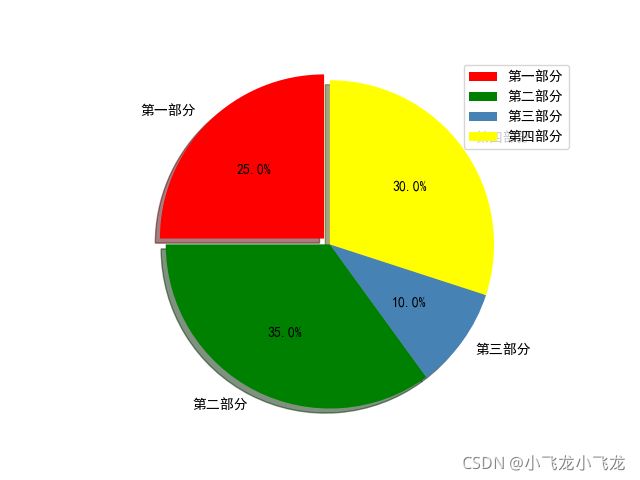
3.绘制饼图
绘制饼图的参数
explode:设置各部分突出
label:设置各部分标签,
labeldistance:设置标签文本距圆心位置,1.1表示1.1倍半径
autopct:设置圆里面文本
shadow:设置是否有阴影
startangle:起始角度,默认从0开始逆时针转
pctdistance:设置圆内文本距圆心距离
返回值
l_text:圆内部文本,matplotlib.text.Text object
p_text:圆外部文本
import matplotlib.pyplot as plt
import numpy as np

#各部分标签
label_list=['第一部分','第二部分','第三部分','第四部分']
#各部分大小(百分比)
size=[25,35,10,30]
# 各部分颜色
color=['red','green','steelblue','yellow']
# 各部分突出值
explode=[0.05,0,0,0]
patches,l_text,p_text=plt.pie(size,colors=color,labeldistance=1.1,autopct="%1.1f%%",explode=explode,labels=label_list,startangle=90,shadow=True)
# patches, l_text, p_text = plt.pie(size, explode=explode, colors=color, labels=label_list,
#                                   labeldistance=1.1, autopct="%1.1f%%", shadow=True, startangle=90, pctdistance=0.6)

plt.axis("equal")    # 设置横轴和纵轴大小相等,这样饼才是圆的
plt.legend()
plt.show()
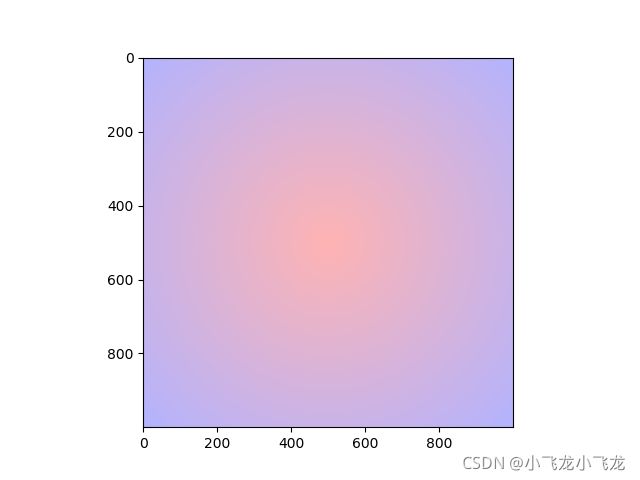
import matplotlib.pyplot as plt
import matplotlib.colors as col
import numpy as np
points = np.arange(-5, 5, 0.01)
# print(points)
xs, ys = np.meshgrid(points, points)

z = np.sqrt(xs**2 + ys**2)
# print(z)
# 自定义colormap
start_color = 'red'
end_color = 'blue'

cmap_1 = col.LinearSegmentedColormap.from_list('cmap1', [start_color, end_color])
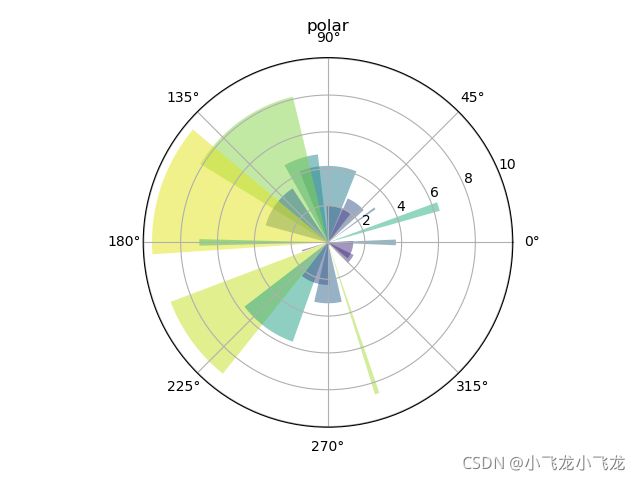
import matplotlib.pyplot as plt
import numpy as np

N = 20
theta = np.linspace(0, 2 * np.pi, N, endpoint=False)  # 均分角度
radii = 10 * np.random.rand(N)  # 随机角度
width = np.pi / 4 * np.random.rand(N)  # 随机宽度

ax = plt.subplot(111, projection='polar')  # 极坐标图绘制
bars = ax.bar(theta, radii, width=width, bottom=0.0)  # 哪个角度画,长度,扇形角度,从距离圆心0的地方开始画

for r, bar in zip(radii, bars):
    bar.set_facecolor(plt.cm.viridis(r / 10.0))
    bar.set_alpha(0.5)  # 添加颜色

plt.title('polar')
plt.show()
import numpy as np
import matplotlib.pyplot as plt

#设置中文字体
plt.rcParams['font.sans-serif']=['Simhei']
# 显示符号
plt.rcParams['axes.unicode_minus']=False


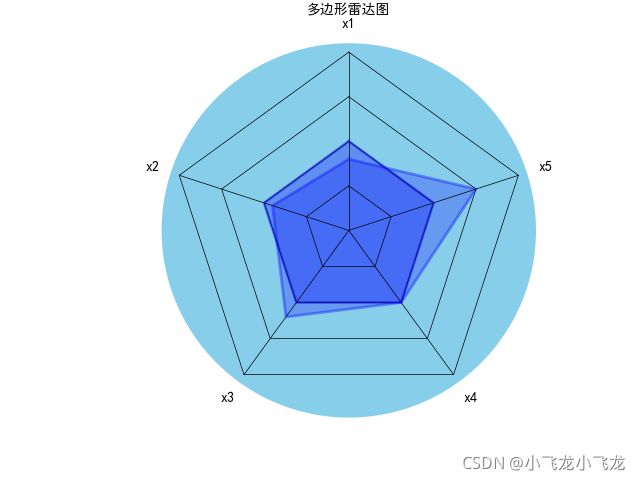
def plot_radar(data):

    criterion = [1, 1, 1, 1, 1, 1] # 基准雷达图
    angles = np.linspace(0, 2 * np.pi, 5, endpoint=False)
    angles = np.concatenate((angles, [angles[0]]))
    #print(criterion)
    #print(angles)
    fig = plt.figure(facecolor='#87CEEB') # 创建画板并填充颜色
    ax = fig.add_subplot(111, polar=True,)  # 设置坐标为极坐标
    # 绘制三个五边形
    floor = 0
    ceil = 2
    labels = np.array(['x1', 'x2', 'x3', 'x4', 'x5'])
    # 绘制五边形的循环
    for i in np.arange(floor, ceil + 0.5 ,0.5):
        ax.plot(angles, [i] * (6), '-', lw= 0.5, color='black')
    for i in range(5):
        ax.plot([angles[i], angles[i]], [floor, ceil], '-',lw=0.5, color='black')
     # 绘制雷达图
    ax.plot(angles, criterion, 'b-', lw=2, alpha=0.4)
    ax.fill(angles, criterion, facecolor='b', alpha=0.3) #填充
    ax.plot(angles, data, 'b-', lw=2, alpha=0.35)
    ax.fill(angles, data, facecolor='b', alpha=0.25)

    ax.set_thetagrids(angles * 180 / np.pi, labels)
    ax.spines['polar'].set_visible(False)#不显示极坐标最外的圆形
    ax.set_theta_zero_location('N')#设置极坐标的起点(即0度)在正上方向
    ax.grid(False)# 不显示分隔线
    ax.set_yticks([]) # 不显示坐标间隔
    ax.set_title('xxxxxxxxxxxx', va='bottom', fontproperties='SimHei')
    ax.set_facecolor('#87ceeb') # 填充绘图区域的颜色
    # 保存文png图片
    plt.subplots_adjust(left=0.09, right=1, wspace=0.25, hspace=0.25, bottom=0.13, top=0.91)
    plt.savefig('a_1.png')
    plt.show()
data = [0.8, 0.9, 1.2, 1.0, 1.5, 0.8]
plot_radar(data)
from tqdm import tqdm
import time

#方法一
with tqdm(total=200) as pbar:
    for i in range(20):
        pbar.update(10)
        time.sleep(0.1)

# 方法二
pbar=tqdm(total=200)
for i in range(20):
    pbar.update(10)
    time.sleep(0.1)
pbar.close()


