实验卡方检验
1 SPSS Chi-Square Independence Test Tutorial
2 Chi-Square Independence Test – What and Why?
3 SPSS One Sample Chi-Square Test
4 卡方检验运用中常见的3大错误,来看实例!
5 结合日常生活的例子,了解什么是卡方检验
6 Linear-by-Linear Association 是指你所分析的列联表(Crosstable)它的行变量(Row variable)与列变量都是一种有序变量(ordinal)的。比方1(Very dissatisfied),2(dissatisfied),3(Satsified), 4(Very satisfied),表示程度加深的变化。当Linear-by-Linear Association得P值小于0.05时,那么统计学上认为线性相关效果显著(不论正负)。Pearson Chi-Square只是看两者是否有相互影响效应不一定变量是ordinal的。
有可能Pearson Chi-Square的p值是大于0.05但Linear-by-Linear Association的p值小于0.05,关键就是看你所给的数据行列变量是不是Ordinal。
7 The Crosstabs procedure is available from the menus at Analyze->Descriptive Statistics->Crosstabs. Paste one variable into the Rows(s) box and the other into the Column(s) box. (You can place multiple variables into each box and receive one crosstab table and chi-square set for each row*column combination.) Click the Statistics button and check the chi-square box in the upper-left corner of the Statistics dialog box to request chi-square statistics. The MH test for trend will be printed in the "Chi-Square Tests" table and labelled "Linear-by-Linear Association". Note that this test will not be printed for any table in which either the row or column variable is a string variable. You can recode such a variable into a new numeric variable and use that numeric variable in the Crosstabs procedure. The Crosstabs procedure does not apply the Measure attribute of the variables in the data dictionary, so the result of this test will not depend on whether the variables are marked as Scale, Ordinal, or Nominal. Note that the formula above applies the Pearson correlation so the variables are effectively treated as Scale for this test.
This is a useful statistic for those who understand it. Suppose we investigate whether 78 employees' promotion (yes/no) is related to their performance ranking in the previous year (1-4, 1=low), as follows:
Ranking 1: Not promoted 17, Promoted 2, Total 19.
Ranking 2: Not promoted 16, Promoted 4, Total 20.
Ranking 3: Not promoted 14, Promoted 6, Total 20.
Ranking 4: Not promoted 10, Promoted 9, Total 19.
SPSS shows a significant linear-by-linear association (p=.008) showing that there is a significant association between the ranking and being promoted.
Some useful details of how this works are:
1. The test relates to the odds. Odds are used for their statistical properties, and are not quite the same as probabilities. For ranking 1, the odds of being promoted are 2:17, as opposed to the probability which is 2:19.
2. Then, the test is on the odds ratios; e.g. if you move from rank 1 to rank 2, the odds ratio is 4:16/2:17 = 0.250/0.118 = 2.12. (The null hypothesis is that the odds ratio is 1, i.e. a change in ranks makes no difference to the odds.)
3. The procedure presumes that the odds ratios (in the population) are the same for all steps (i.e. if moving from rank 1 to rank 2 doubles the odds of promotion, moving from rank 2 to rank 3 would also double the odds of promotion). That is why there is only 1 degree of freedom. (This assumption is known as "linearity in the logit".)
4. The test is therefore conceptually the same (and gives a similar answer) to doing logistic regression with just one covariate. (In logistic regression, "covariate" means a variable like this one). In this case the covariate would be ranking, and the DV would be promotion decision.
8 What does “linear-by-linear association” in SPSS mean?
9 实验中几种情况排序用chi
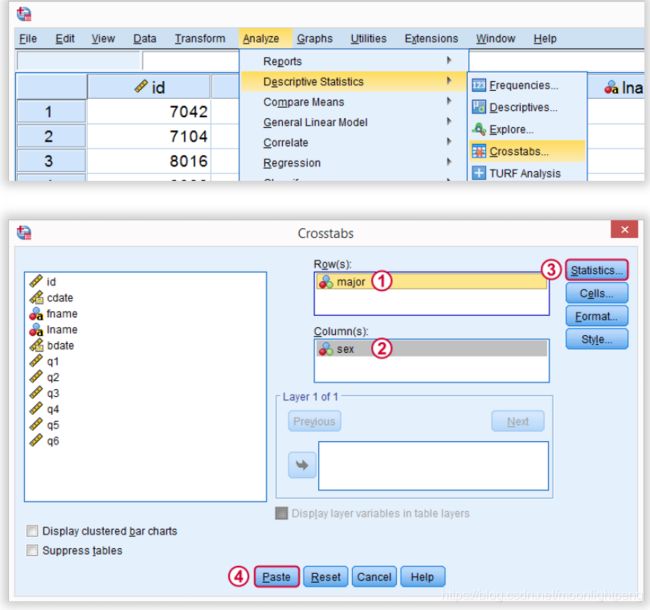
图中4用下面的代码
*Crosstabs with Chi-Square test as pasted from menu.

CROSSTABS
/TABLES=major BY sex
/FORMAT=AVALUE TABLES
/STATISTICS=CHISQ
/CELLS=COUNT
/COUNT ROUND CELL.
https://www.spss-tutorials.com/spss-chi-square-independence-test/