Python手写实现LDA与QDA算法
Python手写实现LDA与QDA算法
- 简略版
-
- LDA
- QDA
- 完整版
-
- LDA
- QDA
- 对IRIS数据集进行实验
近期实验室在上一门机器学习的讨论班,第一次作业中有一道题要求实现LDA算法与QDA算法,这里LDA部分参考了以下文章与教材,详细的推导在下面的文章里也有介绍:
机器学习算法推导&手写实现03——线性判别分析
《The Elements of Statistical Learning》
QDA部分则是由LDA部分改装成的。LDA与QDA的区别就在于LDA的判别函数值为:
δ k ( x ) = x T Σ − 1 μ k − 1 2 μ k T Σ − 1 μ k + log π k . \delta_k(x) = x^T\Sigma^{-1}\mu_k - \dfrac{1}{2}\mu_k^T\Sigma^{-1}\mu_k + \log{\pi_k}. δk(x)=xTΣ−1μk−21μkTΣ−1μk+logπk.
而QDA的判别函数值为:
δ k ( x ) = − 1 2 log ∣ Σ k ∣ − 1 2 ( x − μ k ) T Σ k − 1 ( x − μ k ) + log π k . \delta_k(x) = -\dfrac{1}{2}\log{|\Sigma_k|} - \dfrac{1}{2}(x - \mu_k)^T\Sigma_{k}^{-1}(x - \mu_k) + \log{\pi_k}. δk(x)=−21log∣Σk∣−21(x−μk)TΣk−1(x−μk)+logπk.
首先加载需要用到的库
import numpy as np
import matplotlib.pyplot as plt
from sklearn.datasets import load_iris
from sklearn.metrics import confusion_matrix,precision_score,accuracy_score,recall_score,f1_score
简略版
简略版就是直接返回结果,比较直接明了,但也有个坏处就是不能保存模型,也就是每次预测都得跑一次全数据,而且也没法划分训练集与测试集。
LDA
def LDA(X, y):
    n_samples, n_features = X.shape # 样本数据的样本数、特征维度
    classes, y_idx = np.unique(y, return_inverse = True)
    priorProbs = np.bincount(y) / n_samples
    means = np.zeros((len(classes), n_features))
    np.add.at(means, y_idx, X)
    mu_i = means / np.expand_dims(np.bincount(y), 1) # 每个类别的均值
    mu = np.dot(np.expand_dims(priorProbs, axis = 0), mu_i) # 整体均值
    cov_i = [np.cov(X[y == group].T) for idx, group in enumerate(classes)] # 每个类别的协方差
    cov = sum(cov_i) / len(cov_i) # 整体协方差矩阵

    # 求整体协方差的逆
    Sigma = cov
    U, S, V = np.linalg.svd(Sigma)
    Sn = np.linalg.inv(np.diag(S))
    Sigma_inv = np.dot(np.dot(V.T, Sn), U.T)
    # 线性判别函数值, 求出分类概率
    value = np.dot(np.dot(X, Sigma_inv), mu_i.T) - \
            0.5 * np.multiply(np.dot(mu_i, Sigma_inv).T, mu_i.T).sum(axis = 0).reshape(1, -1) + \
            np.log(np.expand_dims(priorProbs, axis = 0))
    likelihood = np.exp(value - value.max(axis = 1)[:, np.newaxis])
    probs = likelihood / likelihood.sum(axis = 1)[:, np.newaxis]
    pClass = np.argmax(value, axis = 1)
    return probs, pClass
这里的value就是我们的判别函数值。
QDA
QDA算法只需要根据公式修改其中value的表达式。
def QDA(X, y):
    n_samples, n_features = X.shape # 样本数据的样本数、特征维度
    classes, y_idx = np.unique(y, return_inverse = True)
    priorProbs = np.bincount(y) / n_samples
    means = np.zeros((len(classes), n_features))
    np.add.at(means, y_idx, X)
    mu_i = means / np.expand_dims(np.bincount(y), 1) # 每个类别的均值
#    mu = np.dot(np.expand_dims(priorProbs, axis = 0), mu_i) # 整体均值
    cov_i = [np.cov(X[y == group].T) for idx, group in enumerate(classes)] # 每个类别的协方差
#    cov = sum(cov_i) / len(cov_i) # 整体协方差矩阵

    value = np.zeros((n_samples, len(classes)))
    for i in range(len(classes)):
        Sigma_i = cov_i[i]
        U, S, V = np.linalg.svd(Sigma_i)
        Sn = np.linalg.inv(np.diag(S))
        Sigma_i_inv = np.dot(np.dot(V.T, Sn), U.T)
        Xm = X - mu_i[i]
        value[:, i] = -0.5 * np.log(np.expand_dims(np.linalg.det(Sigma_i), axis = 0)) - \
                        0.5 * np.multiply(np.dot(Xm, Sigma_i_inv).T, Xm.T).sum(axis = 0)
    value = value + np.log(np.expand_dims(priorProbs, axis = 0))
    likelihood = np.exp(value - value.max(axis = 1)[:, np.newaxis])
    probs = likelihood / likelihood.sum(axis = 1)[:, np.newaxis]
    pClass = np.argmax(value, axis = 1)
    return probs, pClass
完整版
为了便于预测结果,同时把训练跟测试集分开来,下面把LDA与QDA写成类(这里也是参考了上面的文章,不过去除了降维部分)。
LDA
class LDA(object):
    def __init__(self):
        self.mu_i = 0
        self.mu = 0
        self.cov_i = []
        self.cov = 0
        self.X = 0
        self.y = 0
        self.classes = 0
        self.priorProbs = 0
        self.n_samples = 0
        self.n_features = 0

    def fit(self, X, y):
        self.X, self.y = X, y
        self.n_samples, self.n_features = X.shape
        self.classes, y_idx = np.unique(y, return_inverse = True)
        self.priorProbs = np.bincount(y) / self.n_samples
        means = np.zeros((len(self.classes), self.n_features))
        np.add.at(means, y_idx, X)
        self.mu_i = means / np.expand_dims(np.bincount(y), 1) # 每个类别的均值
        self.mu = np.dot(np.expand_dims(self.priorProbs, axis = 0), self.mu_i) # 整体均值
        self.cov_i = [np.cov(X[y == group].T) for idx, group in enumerate(self.classes)] # 每个类别的协方差
        self.cov = sum(self.cov_i) / len(self.cov_i) # 整体协方差矩阵

        return

    def predict_probs(self, X):
        Sigma = self.cov
        U, S, V = np.linalg.svd(Sigma)
        Sn = np.linalg.inv(np.diag(S))
        Sigma_inv = np.dot(np.dot(V.T, Sn), U.T)
        # 线性判别函数值, 求出分类概率
        value = np.dot(np.dot(X, Sigma_inv), self.mu_i.T) - \
                0.5 * np.multiply(np.dot(self.mu_i, Sigma_inv).T, self.mu_i.T).sum(axis = 0).reshape(1, -1) + \
                np.log(np.expand_dims(self.priorProbs, axis = 0))
        likelihood = np.exp(value - value.max(axis = 1)[:, np.newaxis])
        pred_probs = likelihood / likelihood.sum(axis = 1)[:, np.newaxis]
        return pred_probs

    def predict(self, X):
        pred_probs = self.predict_probs(X)
        pred_value = np.argmax(pred_probs, axis = 1)
        return pred_value
QDA
class QDA(object):
    def __init__(self):
        self.mu_i = 0
        self.mu = 0
        self.cov_i = []
        self.cov = 0
        self.X = 0
        self.y = 0
        self.classes = 0
        self.priorProbs = 0
        self.n_samples = 0
        self.n_features = 0

    def fit(self, X, y):
        self.X, self.y = X, y
        self.n_samples, self.n_features = X.shape
        self.classes, y_idx = np.unique(y, return_inverse = True)
        self.priorProbs = np.bincount(y) / self.n_samples
        means = np.zeros((len(self.classes), self.n_features))
        np.add.at(means, y_idx, X)
        self.mu_i = means / np.expand_dims(np.bincount(y), 1) # 每个类别的均值
        self.mu = np.dot(np.expand_dims(self.priorProbs, axis = 0), self.mu_i) # 整体均值
        self.cov_i = [np.cov(X[y == group].T) for idx, group in enumerate(self.classes)] # 每个类别的协方差
        self.cov = sum(self.cov_i) / len(self.cov_i) # 整体协方差矩阵

        return

    def predict_probs(self, X):
        value = np.zeros((self.n_samples, len(self.classes)))
        for i in range(len(self.classes)):
            Sigma_i = self.cov_i[i]
            U, S, V = np.linalg.svd(Sigma_i)
            Sn = np.linalg.inv(np.diag(S))
            Sigma_i_inv = np.dot(np.dot(V.T, Sn), U.T)
            Xm = X - self.mu_i[i]
            value[:, i] = -0.5 * np.log(np.expand_dims(np.linalg.det(Sigma_i), axis = 0)) - \
                            0.5 * np.multiply(np.dot(Xm, Sigma_i_inv).T, Xm.T).sum(axis = 0)
        value = value + np.log(np.expand_dims(self.priorProbs, axis = 0))
        likelihood = np.exp(value - value.max(axis = 1)[:, np.newaxis])
        pred_probs = likelihood / likelihood.sum(axis = 1)[:, np.newaxis]
        return pred_probs

    def predict(self, X):
        pred_probs = self.predict_probs(X)
        pred_value = np.argmax(pred_probs, axis = 1)
        return pred_value
对IRIS数据集进行实验
最后,这里用IRIS数据集进行训练,同时对比sklearn中自带的库。
这里用了混淆矩阵、准确率,精度、召回率以及F1分数这几个指标进行对比。为了方便,也顺便把输出指标的结果写成函数:
def score_result(y, y_pred, method = None):
    confusion = confusion_matrix(y, y_pred)
    print(method, ' Confusion Matrix: \n', confusion)

    acc = accuracy_score(y, y_pred)
    print(method, ' accuracy = %.3f'%(acc))

    precision = precision_score(y, y_pred, average = 'weighted')
    print(method, ' precision = %.3f'%(precision))

    recall = recall_score(y,y_pred, average = 'weighted')
    print(method, ' recall = %.3f'%(recall))

    F1 = f1_score(y, y_pred, average = 'weighted')
    print(method, ' F1 score = %.3f'%(F1))
    return confusion, acc, precision, recall, F1
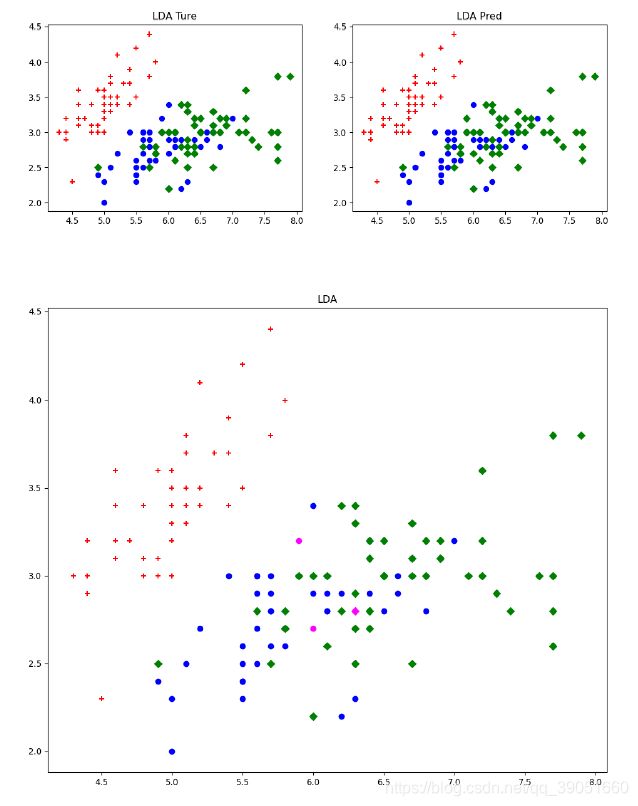
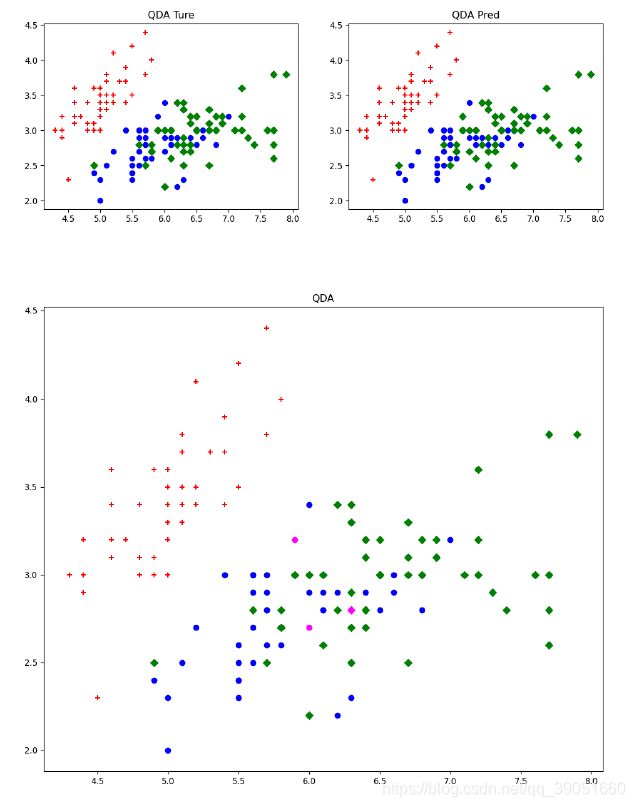
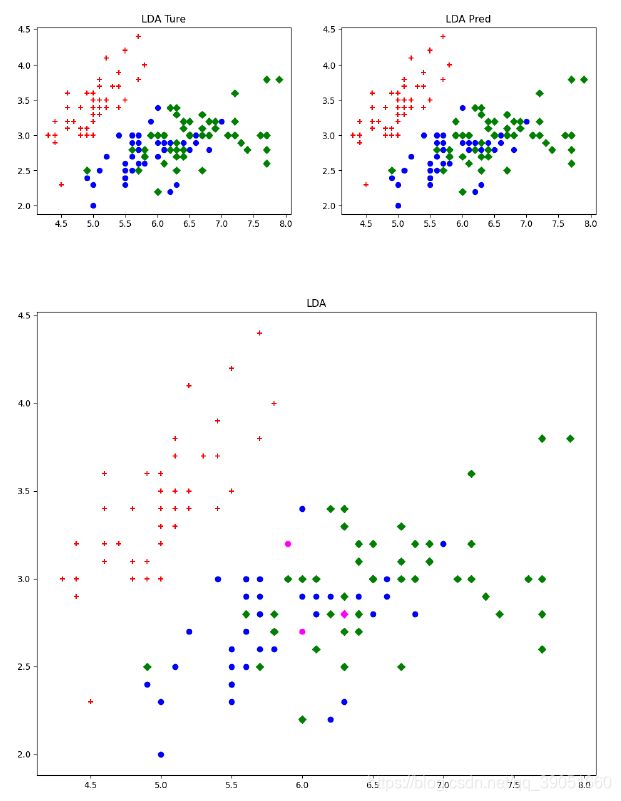
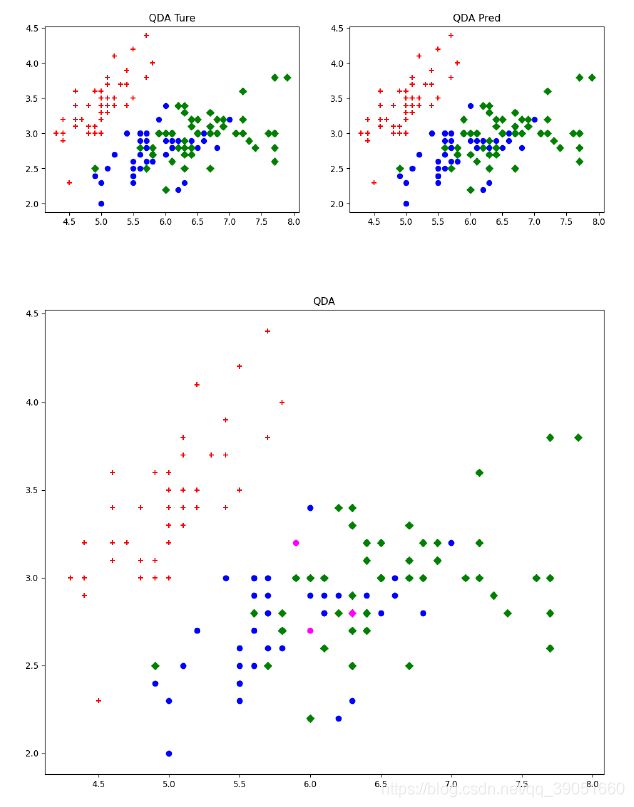
后面也顺便输出分类结果图,所以把画图也写成函数了:
def plot_result(X, y, y_pred, method = None):
    fig = plt.figure(figsize = (12, 4))
    ax1 = fig.add_subplot(1, 2, 1)
    ax1.scatter(X[y == 0, 0], X[y == 0, 1], c = 'r', marker = '+')
    ax1.scatter(X[y == 1, 0], X[y == 1, 1], c = 'b', marker = 'o')
    ax1.scatter(X[y == 2, 0], X[y == 2, 1], c = 'g', marker = 'D')
    ax1.set_title(method + ' Ture')

    ax2 = fig.add_subplot(1, 2, 2)
    ax2.scatter(X[y_pred == 0, 0], X[y_pred == 0, 1], c = 'r', marker = '+')
    ax2.scatter(X[y_pred == 1, 0], X[y_pred == 1, 1], c = 'b', marker = 'o')
    ax2.scatter(X[y_pred == 2, 0], X[y_pred == 2, 1], c = 'g', marker = 'D')
    ax2.set_title(method + ' Pred')
    plt.show()

    plt.figure(figsize = (12, 10))
    for i in range(0, len(y)):
        if y_pred[i] != y[i]:
            if y[i] == 0:
                plt.scatter(X[i, 0], X[i, 1], c = 'magenta', marker = '+', s = 40)
            if y[i] == 1:
                plt.scatter(X[i, 0], X[i, 1], c = 'magenta', marker = 'o', s = 40)
            if y[i] == 2:
                plt.scatter(X[i, 0], X[i, 1], c = 'magenta', marker = 'D', s = 40)
        else:
            if y[i] == 0:
                plt.scatter(X[i, 0], X[i, 1], c = 'r', marker = '+', s = 40)
            if y[i] == 1:
                plt.scatter(X[i, 0], X[i, 1], c = 'b', marker = 'o', s = 40)
            if y[i] == 2:
                plt.scatter(X[i, 0], X[i, 1], c = 'g', marker = 'D', s = 40)
    plt.title(method)
    plt.show()
    return
okk,下面就开始进行训练啦~
# 读取iris数据集
X, y = load_iris(True)

#### LDA
# 构造LDA类进行训练
clf_lda = LDA()
clf_lda.fit(X, y)
pred_probs_LDA = clf_lda.predict_probs(X)
y_pred_LDA = clf_lda.predict(X)
# 输出LDA算法指标
confusion_LDA, acc_LDA, precision_LDA, recall_LDA, F1_LDA = score_result(y, y_pred_LDA, 'LDA')
# 画出LDA结果图
plot_result(X, y, y_pred_LDA, 'LDA')
## LDA Confusion Matrix:
## [[50 0 0]
## [ 0 48 2]
## [ 0 1 49]]
## LDA accuracy = 0.980
## LDA precision = 0.980
## LDA recall = 0.980
## LDA F1 score = 0.980
#### QDA
# 构造QDA类进行训练
clf_qda = QDA()
clf_qda.fit(X, y)
pred_probs_QDA = clf_qda.predict_probs(X)
y_pred_QDA = clf_qda.predict(X)
# 输出QDA算法指标
confusion_QDA, acc_QDA, precision_QDA, recall_QDA, F1_QDA = score_result(y, y_pred_QDA, 'QDA')
# 画出QDA结果图
plot_result(X, y, y_pred_QDA, 'QDA')
## QDA Confusion Matrix:
## [[50 0 0]
## [ 0 48 2]
## [ 0 1 49]]
## QDA accuracy = 0.980
## QDA precision = 0.980
## QDA recall = 0.980
## QDA F1 score = 0.980
最后,调用下sklearn中自带的LDA与QDA进行对比:
### 调用LDA
from sklearn.discriminant_analysis import LinearDiscriminantAnalysis
lda = LinearDiscriminantAnalysis()
ld = lda.fit(X, y).predict(X)
confusion_ld, acc_ld, precision_ld, recall_ld, F1_ld = score_result(y, ld, 'LDA')
plot_result(X, y, ld, 'LDA')
## LDA Confusion Matrix:
## [[50 0 0] ## [ 0 48 2]
## [ 0 1 49]]
## LDA accuracy = 0.980
## LDA precision = 0.980
## LDA recall = 0.980
## LDA F1 score = 0.980
### 调用QDA
from sklearn.discriminant_analysis import QuadraticDiscriminantAnalysis
qda = QuadraticDiscriminantAnalysis()
qd = qda.fit(X, y).predict(X)
confusion_QDA, acc_QDA, precision_QDA, recall_QDA, F1_QDA = score_result(y, qd, 'QDA')
plot_result(X, y, qd, 'QDA')
## QDA Confusion Matrix:
## [[50 0 0]
## [ 0 48 2]
## [ 0 1 49]]
## QDA accuracy = 0.980
## QDA precision = 0.980
## QDA recall = 0.980
## QDA F1 score = 0.980
可以发现,自行实现的LDA算法与QDA算法与sklearn库中自带的LDA与QDA结果一致。不过这里也有一个不好的地方,当时懒了下,没有划分训练集与测试集,这里其实是可以划分下训练集跟测试集的。
以上就是Python手写LDA与QDA算法的全部内容啦~ 今天是个神奇的一天~ 开心地继续下去吧~


