matlab,四种数字图像
1、空间分辨率:例如800*600的图像,就是指横向800个像素,竖向600个像素。
2、灰度分辨率:指像素的数值f(x,y)的级数。若用8个比特来存储某图像的每个像素,则这个图像的灰度值为2^8,即灰度分辨率为256。
3、做一张简单的灰度图像
注:
InitialMagnification' - 图像显示的初始放大倍率
100 (默认) | 数值标量 | 'fit'
clear;clc;close all
A=[0 230
   255 60
   30 100];
A=uint8(A);
imshow(A,'InitialMagnification','fit')
结果:
4、做一张彩色图象
clear;clc;close all
R=[255 30 230
   255 0 100
   0 200 0];
G=[0 80 220
   255 255 50
   0 35 0];
B=[0 200 15
   255 0 190
   0 70 255];
RGB(:,:,1)=R;
RGB(:,:,2)=G;
RGB(:,:,3)=B;
RGB=uint8(RGB);
imshow(RGB,'InitialMagnification','fit')
结果:
5、RGB图像转换成灰度图像
在matlab中,将RGB图像转换为灰度图像,需要调用函数rgb2gray()函数,其具体调用方式如下:
%RGB图象转换为灰度图像
I=imread('YW.jpg');
X=rgb2gray(I);
figure,
subplot(121),imshow(I);
subplot(122),imshow(X);
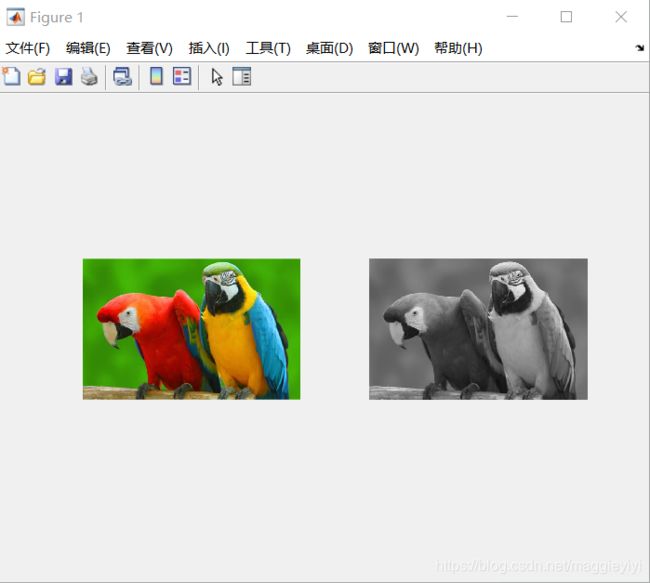
调用后的结果为:
首先,读取YW.jpg彩色图象,然后调用函数rgb2gray()转换为灰度图像,最后将原图像和转换后的灰度图像显示出来。
6、颜色映射表转换灰度图像
输入为颜色映射表,利用函数rgb2gray()生成灰度图像,其具体实现的代码如下:
close all;clear all;clc;
[X,map]=imread('brid.bmp');
newmap=rgb2gray(map);
figure,
subplot(121),imshow(X,map);
subplot(122),imshow(X,newmap);
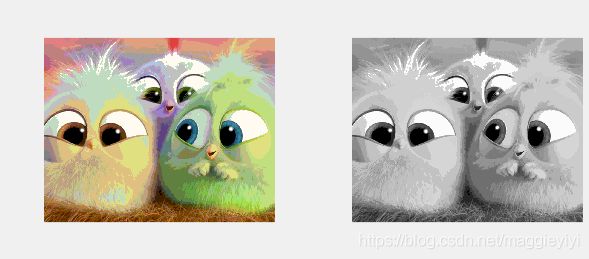
结果如下:
程序首先读取索引图象brid.bmp的信息,变量map中存放的是该图像的彩色映射表数据,然后调用函数rgb2gray()将彩色演的映射表变换为灰色。
上述,我们可以看到map、newmap的基本信息。
7、RGB图像转换为索引图像
在Matlab中,将真彩图像转换为索引图像直接调用rgb2ind()。
[X,map]=rgb2ind(I,tol):该函数是利用均匀量化的方法RGB图像转换为索引图像。其中,I就是原RGB图像,tol的范围是从0.0至1.0,[X,map]对应生成的索引图像,map包含至少(floor(1/tol)+1)^3个颜色。
[X,map]=rgb2ind(I,N):该函数是利用最小化方差量化的方法,将RGB图像转换为索引图像。其中,I就是原RGB图像,[X,map]对应生成的索引图像,map中包含至少N个颜色。
X=rgb2ind(I,map):该函数是通过与RGB中最相近的颜色进行匹配生成颜色映射表map,将RGB图像转换为索引色图像。
具体代码:
close all;clear all;clc;
RGB=imread('YW.jpg');
[X1,map1]=rgb2ind(RGB,64);
[X2,map2]=rgb2ind(RGB,0.2);
map3=colorcube(128);
X3=rgb2ind(RGB,map3);
figure;
subplot(131);imshow(X1,map1);
subplot(132);imshow(X2,map2);
subplot(133);imshow(X3,map3);
结果:
8、灰度图像转换为索引图像
代码如下:
close all;clear all;clc;
RGB=imread('YW.jpg');
I=rgb2gray(RGB);
[X,map1]=gray2ind(I,8);
figure;
subplot(131);imshow(RGB);
subplot(132);imshow(I);
subplot(133);imshow(X,map1);
图一,彩色图像。
图二,灰色图像。
图三,索引图像。
9、利用阈值法将灰度图像转换为索引图像
其具实现MATLAB代码如下:
利用灰度均匀量化法调用函数grayslice(),将灰度图像I转换为索引图像X,灰度等级划分为32个。显示索引图像时,利用jet()函数,生成一个颜色映射表,给图像X对应像素点加上颜色,颜色变化从深蓝、蓝色、蓝绿色、黄色、红色到深红色。
close all;clear all;clc;
I=imread('YW.jpg');
X=grayslice(I,32);
figure,imshow(I);
figure,imshow(X,jet(32));
10、索引图像转换灰度图像
具体代码如下:
[X,map1]=imread('brid.bmp');
I=ind2gray(X,map1);
figure;
subplot(121);imshow(X,map1);
subplot(122);imshow(I);
结果:
11、将灰度图转换为二值图
close all;clear all;clc;
I=imread('HSQ.jpg');
BW1=im2bw(I,0.4);
BW2=im2bw(I,0.6);
figure;
subplot(131);imshow(I);
subplot(132);imshow(BW1);
subplot(133);imshow(BW2);
结果:
通过比较发现,二值图像只有黑白两种灰色值。
level值小,会背景区与目标区混淆。
level值大,会丢失部分目标信息。


