antv/x6_2.0学习使用(二、画布)
画布
一. 创建容器
- 在页面中创建一个 div 标签,用来容纳画布
<div id="container">div>
- 画布常用配置信息
const graph = new Graph({
	container: graphRef.value, // 画布容器
	width: 800, // 画布宽度,默认使用容器宽度
	height: 600, // 画布高度,默认使用容器高度
	autoResize: false, // 是否监听容器大小改变,并自动更新画布大小。
	background: { color: "#F2F7FA" },
	grid: {
		// 网格,默认使用 10px 的网格,但不绘制网格背景
		size: 10,
		visible: true,
		// 网格类型,内置四种网格类型
		// dot(默认值) -> 点状网格
		// fixedDot -> 固定网点大小的点状网格。当画布的缩放比例小于 1 时,网点大小随着画布缩放比例缩放,当画布缩放比例大于 1 时,网点大小为给定的 thickness 的值。
		// mesh -> 网状网格
		// doubleMesh -> 双线网状网格
		type: "doubleMesh",
		args: [
			{
				color: "#eee", // 主网格线颜色
				thickness: 1, // 主网格线宽度
			},
			{
				color: "#ddd", // 次网格线颜色
				thickness: 1, // 次网格线宽度
				factor: 4, // 主次网格线间隔
			},
		],
	},
	panning: {
		// 画布是否可以拖拽平移,默认禁用。
		enabled: true, // 是否开启画布平移交互。

		// 触发画布平移的交互方式。支持三种形式或者他们之间的组合:
		// leftMouseDown: 按下鼠标左键移动进行拖拽
		// rightMouseDown: 按下鼠标右键移动进行拖拽
		// mouseWheel: 使用鼠标滚轮滚动拖拽
		// mouseWheelDown: 按下鼠标滚轮进行拖拽
		eventTypes: ["rightMouseDown"],
	},
	mousewheel: true, // 鼠标滚轮缩放,默认禁用
	connecting: {
		allowEdge: false, // 是否允许边链接到另一个边,默认为 true
		allowMulti: false, // 是否允许在相同的起始节点和终止之间创建多条边,默认为 true
		allowLoop: false, // 是否允许创建循环连线,即边的起始节点和终止节点为同一节点,默认为 true
		allowBlank: false, // 是否允许连接到画布空白位置的点
		validateConnection({
			// 在移动边的时候判断连接是否有效,如果返回 false,当鼠标放开的时候,不会连接到当前元素,否则会连接到当前元素
			sourceView,
			targetView,
			sourceMagnet,
			targetMagnet,
		}) {
			if (!sourceMagnet) return false;
			if (!targetMagnet) return false;
			return true;
		},
	},
	embedding: {
		//可以将一个节点拖动到另一个节点中,使其成为另一节点的子节点
		enabled: true,
		findParent({ node }) {
			const bbox = node.getBBox();
			return this.getNodes().filter((node) => {
				// 只有 data.parent 为 true 的节点才是父节点
				const data = node.getData();
				if (data && data.parent) {
					const targetBBox = node.getBBox();
					return bbox.isIntersectWithRect(targetBBox);
				}
				return false;
			});
		},
	},
});
二. 渲染节点和边
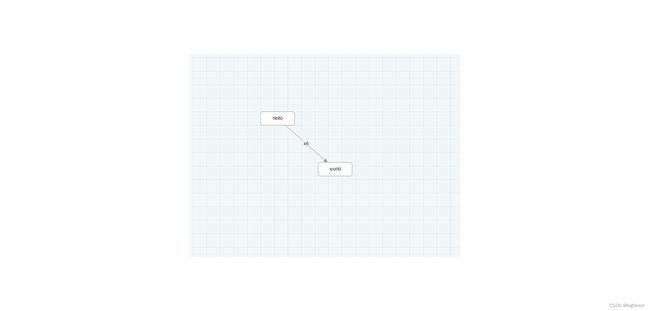
- X6 支持 JSON 格式数据,该对象中 nodes 代表节点数据,edges 代表边数据,可以使用 attrs 属性来定制节点和边的样式(可以类比 CSS)。
// 画布加载的数据
const data = {
	nodes: [
		{
			id: "node1",
			shape: "rect",
			x: 40,
			y: 40,
			width: 100,
			height: 40,
			label: "hello",
			attrs: {
				body: {
					stroke: "#8f8f8f",
					strokeWidth: 1,
					fill: "#fff",
					rx: 6,
					ry: 6,
				},
			},
		},
		{
			id: "node2",
			shape: "rect",
			x: 160,
			y: 180,
			width: 100,
			height: 40,
			label: "world",
			attrs: {
				body: {
					stroke: "#8f8f8f",
					strokeWidth: 1,
					fill: "#fff",
					rx: 6,
					ry: 6,
				},
			},
		},
	],
	edges: [
		{
			shape: "edge",
			source: "node1",
			target: "node2",
			label: "x6",
			attrs: {
				line: {
					stroke: "#8f8f8f",
					strokeWidth: 1,
				},
			},
		},
	],
};

graph.fromJSON(data); // 画布渲染数据
graph.centerContent(); // 将画布内容中心与视口中心对齐
三. 画布大小自适应问题
在实例化 Graph 对象的时候,可以通过设置 width 和 height 固定画布大小,如果不设置,就会以画布容器大小初始化画布。
- 在项目实践中,经常会遇到下面两种场景:
- 画布容器还没有渲染完成(此时尺寸为 0),就实例化画布对象,导致画布元素显示异常。
- 页面的 resize 导致画布容器大小改变,导致画布元素显示异常。
可以使用 autoResize 配置来解决上述问题。
<!-- 注意,使用 autoResize 配置时,需要在画布容器外面再套一层宽高都是 100% 的外层容器,在外层容器上监听尺寸改变,当外层容器大小改变时,画布自动重新计算宽高以及元素位置。 -->
<div style="width:100%; height:100%">
  <div id="container"></div>
</div>
const graph = new Graph({
	container: document.getElementById("container"),
	autoResize: true,
});
三. 常用AIP
graph.resize(800, 600) // resize 画布大小
graph.translate(20, 20) // 在 x、y 方向上平移画布
graph.zoom(0.2) // 将画布缩放级别增加 0.2(默认为1)
graph.zoom(-0.2) // 将画布缩放级别减少 0.2
graph.zoomTo(1.2) // 将画布缩放级别设置为 1.2
// 将画布中元素缩小或者放大一定级别,让画布正好容纳所有元素,可以通过 maxScale 配置最大缩放级别
graph.zoomToFit({ maxScale: 1 })
graph.centerContent() // 将画布中元素居中展示
