线性判别分析LDA((公式推导+举例应用))
文章目录
-
-
- 引言
- 模型表达式
- 拉格朗日乘子法
- 阈值分类器
- 结论
- 实验分析
-
引言
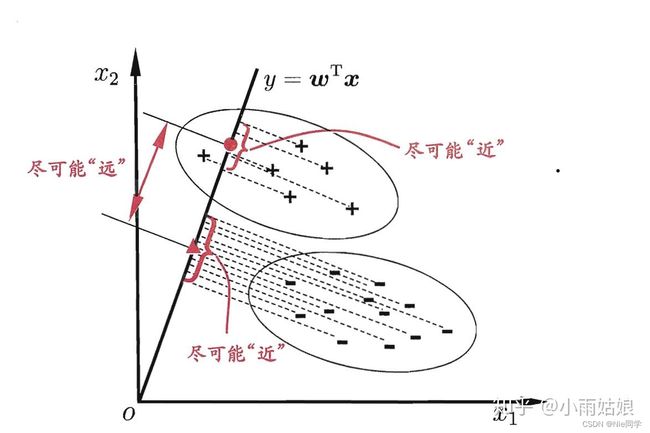
线性判别分析(Linear Discriminant Analysis,简称LDA)是一种经典的监督学习算法,其主要目标是通过在降维的同时最大化类别之间的差异,为分类问题提供有效的数据表征。LDA不同于一些无监督降维方法,如主成分分析(PCA),它充分利用了类别信息,通过寻找最佳投影方向,使得不同类别的样本在降维后的空间中有最大的类间距离,同时保持同一类别内的样本尽量接近。
LDA的基本思想是通过最大化类别间的散布矩阵与类别内的散布矩阵的比值,来实现对数据的降维。在这个过程中,LDA通过解决广义特征值问题,找到了最优的投影方向,从而能够将原始高维数据映射到一个维度更低的空间中,同时保留了最重要的类别间信息。
模型表达式
我们先定义两个变量
- 类别内散布矩阵:反应同一个类别内数据的离散程度。
S w = ∑ x ∈ X 0 ( x − μ 0 ) ( x − μ 0 ) T + ∑ x ∈ X 1 ( x − μ 1 ) ( x − μ 1 ) T S_w=\sum_{x\in X_0}(x-\mu_0)(x-\mu_0)^T+\sum_{x\in X_1}(x-\mu_1)(x-\mu_1)^T Sw=x∈X0∑(x−μ0)(x−μ0)T+x∈X1∑(x−μ1)(x−μ1)T - 类别间散布矩阵:反应不同类别间数据的离散程度。
S b = ( μ 0 − μ 1 ) ( μ 0 − μ 1 ) T S_b=(\mu_0-\mu_1)(\mu_0-\mu_1)^T Sb=(μ0−μ1)(μ0−μ1)T
其中, X i X_i Xi、 μ i \mu_i μi分别表示第 i ∈ { 0 , 1 } i\in \{0,1\} i∈{0,1}类示例的集合和均值向量。
我们的目标欲使同类样例的投影点尽可能的相近,即 S w S_w Sw尽可能的小。而欲使异类的样例投影点尽可能远离,即 S b S_b Sb尽可能大。同时考虑二者,则可得到欲最大化的目标:
J = w T S b w w T S w w J=\frac{w^TS_bw}{w^TS_ww} J=wTSwwwTSbw

拉格朗日乘子法
我们可以发现 J J J的解与 w w w长度无关,只与 w w w的方向有关。不失一般性,令 w T S w w = 1 w^TS_ww=1 wTSww=1,则可等价于算以下式子:
m i n w − w T S b w s . t . w T S w w = 1 \begin{align*} min_w\ -w^TS_bw \\ s.t. \quad w^TS_ww=1 \end{align*} minw −wTSbws.t.wTSww=1
由拉格朗日乘子法,上式等价于:
S b w = λ S w w S_bw=\lambda S_ww Sbw=λSww
其中 λ \lambda λ是拉格朗日乘子法。
{ S b w = λ S w w S b w = ( μ 0 − μ 1 ) ( μ 0 − μ 1 ) T w \begin{cases} S_bw=\lambda S_ww\\ S_bw=(\mu_0-\mu_1)(\mu_0-\mu_1)^Tw \end{cases} {Sbw=λSwwSbw=(μ0−μ1)(μ0−μ1)Tw
又因为 ( μ 0 − μ 1 ) T w (\mu_0-\mu_1)^Tw (μ0−μ1)Tw是标量,又因为只与方向有关,可令 ( μ 0 − μ 1 ) T w = C (\mu_0-\mu_1)^Tw=C (μ0−μ1)Tw=C,联立可解得
λ C S w w = ( μ 0 − μ 1 ) \frac{\lambda}{C}S_ww=(\mu_0-\mu_1) CλSww=(μ0−μ1)
只与大小有关,令 λ C = 1 \frac{\lambda}{C}=1 Cλ=1,有
w = S w − 1 ( μ 0 − μ 1 ) w=S_w^{-1}(\mu_0-\mu_1) w=Sw−1(μ0−μ1)
阈值分类器
最终将投影到直线的数据 w T x i w^Tx_i wTxi送入阈值分类器中,而阈值分类器是一类简单的二元分类器,它通过设定一个阈值来决定样本属于哪个类别。
有以下几种阈值分类器:
- 固定阈值分类器:简单的阈值分类器,将某个特征的值与预先设定的阈值进行比较。例如,如果某个特征的值大于阈值,则分类为一类,否则为另一类。
- 百分位阈值分类器:基于数据的百分位进行分类,例如选择数据中的第75百分位作为阈值。这对于处理偏斜分布的数据可能更合适。
- 基于经验法则的分类器:有时候,根据领域专业知识或经验,可以设定一些规则来确定阈值。例如,根据某个特定的业务规则来分类。
- ROC曲线选择阈值:通过绘制接收者操作特征(ROC)曲线,可以选择最适合任务的阈值。ROC曲线以真正例率和假正例率为横纵坐标,通过改变阈值,可以得到不同的点,选择最适合的操作点作为阈值。
- 最大化特定性或敏感性:有时根据任务需求,可以选择使得分类器具有最大特定性或最大敏感性的阈值。
- 基于平均值的分类器:基于平均值的阈值分类器是一种简单的二元分类方法,其原理是将数据集中某个特征的值与该特征的平均值进行比较,然后根据比较结果将数据分为两个类别。
结论
通过深入分析线性判别分析(Linear Discriminant Analysis,简称LDA)的基本思想和模型表达式,以及阈值分类器的选择方式,我们得出以下结论:
LDA的核心思想是在降维的同时最大化类别之间的差异,通过寻找最佳投影方向,使得不同类别的样本在降维后的空间中有最大的类间距离,同时保持同一类别内的样本尽量接近。该方法不同于一些无监督降维方法,如主成分分析(PCA),因为它充分利用了类别信息。
模型表达式中,我们定义了类别内散布矩阵 S w S_w Sw和类别间散布矩阵 S b S_b Sb,并通过最大化二者比值来找到最优的投影方向。使用拉格朗日乘子法,我们导出了投影方向 w w w的表达式,即 w = S w − 1 ( μ 0 − μ 1 ) w=S_w^{-1}(\mu_0-\mu_1) w=Sw−1(μ0−μ1)。
在阈值分类器的选择方面,我们介绍了几种不同的方法,包括固定阈值分类器、百分位阈值分类器、基于经验法则的分类器、ROC曲线选择阈值、最大化特定性或敏感性的分类器以及基于平均值的分类器。这些分类器可根据具体任务需求和数据特点进行选择。
在实际应用中,我们需要根据任务需求和数据特点选择合适的阈值分类器,并通过绘制ROC曲线等方式来评估模型性能。不同的任务可能需要权衡分类器的特定性和敏感性,或者根据领域专业知识设定阈值,以达到更好的分类效果。
综上所述,LDA作为一种经典的监督学习算法,通过降维和分类任务中的优异性能,在实际应用中具有广泛的应用前景。合理选择阈值分类器,结合领域专业知识,能够更好地发挥LDA在数据表征和分类方面的优势。
实验分析
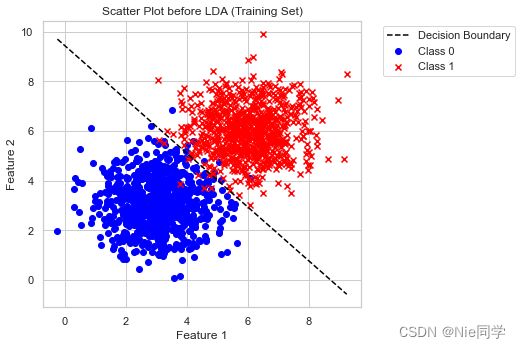
以下是特征1、特征2对应类别的数据集。
import numpy as np
import pandas as pd
import matplotlib.pyplot as plt
import seaborn as sns
sns.set(context="notebook", style="whitegrid", palette="deep")

# 读入数据集
data = pd.read_csv('data/lda_dataset.csv')

# 提取特征和标签
X = data[['Feature_1', 'Feature_2']].values
y = data['Label'].values

# 将数据集分割为训练集和测试集
train_size = int(0.8 * len(X))
X_train, y_train = X[:train_size], y[:train_size]
X_test, y_test = X[train_size:], y[train_size:]

# 计算类别均值
mean_class0 = np.mean(X_train[y_train == 0], axis=0)
mean_class1 = np.mean(X_train[y_train == 1], axis=0)

# 计算类内散度矩阵(Within-class scatter matrix)
Sw = np.dot((X_train[y_train == 0] - mean_class0).T, (X_train[y_train == 0] - mean_class0)) + np.dot((X_train[y_train == 1] - mean_class1).T, (X_train[y_train == 1] - mean_class1))

# 计算类间散度矩阵(Between-class scatter matrix)
Sb = np.outer((mean_class0 - mean_class1), (mean_class0 - mean_class1))

# 计算广义特征值问题的解
eigenvalues, eigenvectors = np.linalg.eig(np.linalg.inv(Sw).dot(Sb))

# 选取前N-1个特征向量
sorted_indices = np.argsort(eigenvalues)[::-1]
w = eigenvectors[:, sorted_indices[:1]]

# 投影训练数据
X_train_lda = np.dot(X_train, w)

# 投影测试数据
X_test_lda = np.dot(X_test, w)
- 采用基于平均值的分类器
from sklearn.metrics import accuracy_score, confusion_matrix, classification_report

# 定义简单的线性阈值分类器
threshold = np.mean(X_train_lda)
y_pred_train = (X_train_lda > threshold).astype(int)
y_pred_test = (X_test_lda > threshold).astype(int)

# 绘制决策边界
threshold = np.dot((mean_class0 + mean_class1) / 2, w)
x_boundary = np.linspace(min(X[:, 0]), max(X[:, 0]), 100)
y_boundary = (threshold - x_boundary * w[0]) / w[1]

# 绘制投影前的散点图
plt.figure(figsize=(12, 5))

plt.subplot(1, 2, 1)
plt.scatter(X_train[y_train == 0][:, 0], X_train[y_train == 0][:, 1], c='blue', label='Class 0', marker='o')
plt.scatter(X_train[y_train == 1][:, 0], X_train[y_train == 1][:, 1], c='red', label='Class 1', marker='x')
plt.title('Scatter Plot before LDA (Training Set)')
plt.plot(x_boundary, y_boundary, color='black', linestyle='--', label='Decision Boundary')
plt.xlabel('Feature 1')
plt.ylabel('Feature 2')
plt.legend(bbox_to_anchor=(1.05, 1), loc='upper left')

plt.tight_layout()
plt.show()

# 输出准确率、混淆矩阵和分类报告
print("Testing Accuracy:", accuracy_score(y_test, y_pred_test))

conf_matrix_test = confusion_matrix(y_test, y_pred_test)
print("Confusion Matrix (Testing Set):\n", conf_matrix_test)

class_report_test = classification_report(y_test, y_pred_test)
print("Classification Report (Testing Set):\n", class_report_test)
Testing Accuracy: 0.975
Confusion Matrix (Testing Set):
 [[178   4]
 [  6 212]]
Classification Report (Testing Set):
               precision    recall  f1-score   support

           0       0.97      0.98      0.97       182
           1       0.98      0.97      0.98       218

    accuracy                           0.97       400
   macro avg       0.97      0.98      0.97       400
weighted avg       0.98      0.97      0.98       400
- 测试准确度: 0.975
- 精确度: 分类为正例的样本中,实际为正例的比例。对于类别0和类别1,分别为0.97和0.98。
- 召回率: 实际为正例的样本中,被成功分类为正例的比例。对于类别0和类别1,分别为0.98和0.97。
- F1分数: 精确度和召回率的加权调和平均。对于类别0和类别1,分别为0.97和0.98。
综合而言,该模型在测试集上取得了较高的准确性,混淆矩阵显示了良好的分类结果,而分类报告进一步确认了其在精确度、召回率和F1分数上的优越表现。
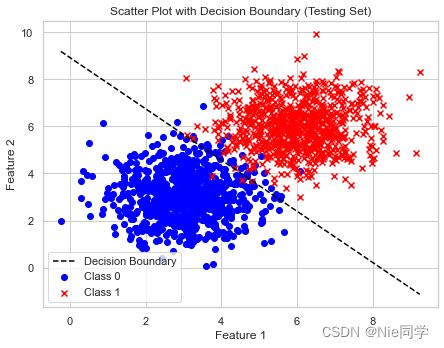
- 采用ROC曲线选择阈值
from sklearn.metrics import roc_curve, roc_auc_score

# 计算 ROC 曲线
fpr, tpr, thresholds = roc_curve(y_test, X_test_lda)

# 计算 AUC
roc_auc = roc_auc_score(y_test, X_test_lda)

# 绘制 ROC 曲线
plt.figure(figsize=(8, 6))
plt.plot(fpr, tpr, color='darkorange', lw=2, label='ROC curve (AUC = {:.2f})'.format(roc_auc))
plt.plot([0, 1], [0, 1], color='navy', lw=2, linestyle='--')
plt.xlim([0.0, 1.0])
plt.ylim([0.0, 1.05])
plt.xlabel('False Positive Rate')
plt.ylabel('True Positive Rate')
plt.title('Receiver Operating Characteristic (ROC)')
plt.legend(loc='lower right')

plt.tight_layout()
plt.show()

# 选择最佳阈值
best_threshold_index = np.argmax(tpr - fpr)
best_threshold = thresholds[best_threshold_index]

# 根据最佳阈值重新定义分类器结果
y_pred_best_threshold_test = (X_test_lda > best_threshold).astype(int)

# 计算决策边界

x_values = np.linspace(min(X[:, 0]), max(X[:, 0]), 100)
y_values = (best_threshold - x_values * w[0]) / w[1]

# 绘制散点图和决策边界(在原始特征空间中)
plt.figure(figsize=(12, 5))

# 散点图
plt.subplot(1, 2, 1)
plt.scatter(X_train[y_train == 0][:, 0], X_train[y_train == 0][:, 1], c='blue', label='Class 0', marker='o')
plt.scatter(X_train[y_train == 1][:, 0], X_train[y_train == 1][:, 1], c='red', label='Class 1', marker='x')
plt.plot(x_values, y_values, color='black', linestyle='--', label='Decision Boundary')
plt.title('Scatter Plot before LDA (Testing Set)')
plt.xlabel('Feature 1')
plt.ylabel('Feature 2')
plt.legend()

plt.title('Scatter Plot with Decision Boundary (Testing Set)')
plt.xlabel('Feature 1')
plt.ylabel('Feature 2')
plt.legend()

plt.tight_layout()
plt.show()


# 输出准确率、混淆矩阵和分类报告(使用最佳阈值)
print("Testing Accuracy (Best Threshold):", accuracy_score(y_test, y_pred_best_threshold_test))

conf_matrix_test_best_threshold = confusion_matrix(y_test, y_pred_best_threshold_test)
print("Confusion Matrix (Testing Set - Best Threshold):\n", conf_matrix_test_best_threshold)

class_report_test_best_threshold = classification_report(y_test, y_pred_best_threshold_test)
print("Classification Report (Testing Set - Best Threshold):\n", class_report_test_best_threshold)
Testing Accuracy (Best Threshold): 0.9775
Confusion Matrix (Testing Set - Best Threshold):
 [[175   7]
 [  2 216]]
Classification Report (Testing Set - Best Threshold):
               precision    recall  f1-score   support

           0       0.99      0.96      0.97       182
           1       0.97      0.99      0.98       218

    accuracy                           0.98       400
   macro avg       0.98      0.98      0.98       400
weighted avg       0.98      0.98      0.98       400
- 测试准确度: 0.9775
- 精确度: 模型正确预测正类别的概率。在测试集上,正类别的精确度为 0.97。
- 召回率: 模型正确预测正类别的概率。在测试集上,正类别的精确度为 0.97。
- F1分数: 精确度和召回率的调和平均值。在测试集上,F1-score 为 0.98。
总体而言,模型在测试集上取得了很好的性能,具有高的准确率、精确度和召回率。
两种选择阈值策略的对比:
- 采用 ROC 曲线选择阈值的策略在准确率上略微优于基于平均值的分类器。
- 采用 ROC 曲线选择阈值的策略在混淆矩阵和分类报告中显示更多的 True Positive(TP)和稍少的 False Positive(FP)。
- 两种策略都表现出很高的准确率、精确度、召回率和 F1 分数,但采用 ROC 曲线选择阈值的策略在某些指标上稍微更优。
综合而言,两种策略都取得了良好的性能,但具体选择哪种策略可能取决于任务的具体需求和偏好。


