【目标检测】评价指标:混淆矩阵概念及其计算方法(yolo源码)
本篇文章首先介绍目标检测任务中的评价指标
混淆矩阵的概念,然后介绍其在yolo源码中的实现方法。
目标检测中的评价指标:
mAP概念及其计算方法(yolo源码/pycocotools)
混淆矩阵概念及其计算方法(yolo源码)
本文目录
- 1 概念
- 2 计算方法
1 概念
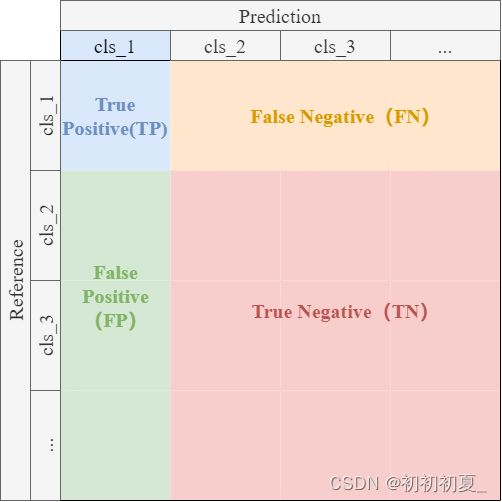
在分类任务中,混淆矩阵(Confusion Matrix)是一种可视化工具,主要用于评价模型精度,将模型的分类结果显示在一个矩阵中。多分类任务的混淆矩阵结构如图1所示,其中横轴表示模型预测结果,纵轴表示实际结果,图中的各类指标以cls_1的预测结果为例,其含义如下:
True Positive(TP):预测为正样本(cls_1),且实际为正样本(cls_1)各类别TP:混淆矩阵对角线的值
False Positive(FP):预测为正样本(cls_1),但实际为负样本(cls_other)各类别FP:混淆矩阵每列的和减去对应的TP
False Negative(FN):预测为负样本(cls_other),但实际为正样本(cls_1)各类别(FN:混淆矩阵每行的和减去对应的TP
True Negative(TN): 预测为负样本(cls_other),且实际为负样本(cls_other)各类别FN:混淆矩阵的和减去对应的TP、FP、FN
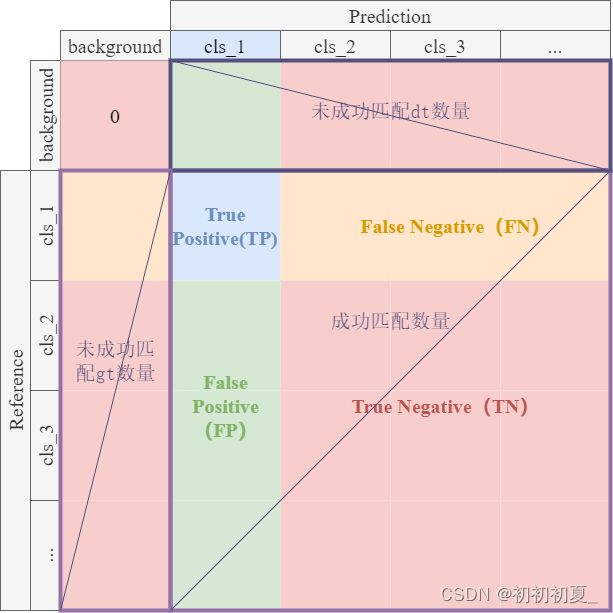
目标检测的任务为对目标进行分类与定位,模型的预测结果p为(cls, conf, pos),其中cls为目标的类别,conf为目标属于该类别的置信度,pos为目标的预测边框。目标检测任务综合类别预测结果和预测边框与实际边框IoU,对模型进行评价,其混淆矩阵结构如图2所示,图中的各类指标以cls_1的预测结果为例,其含义如下:
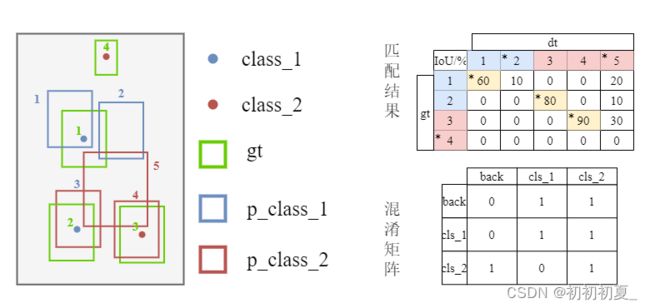
- 样本匹配(每一张图片):预测结果
gt与实际结果dt匹配IoU > IoU_thres- 同一个
gt至多匹配一个p(若一个gt匹配到多个p,则选择IoU最高的p作为匹配结果) - 同一个
gt至多匹配一个p(若一个p匹配到多个gt,则选择IoU最高的gt作为匹配结果)
background: 未成功匹配的gt或dtTrue Positive(TP):匹配结果为正样本(cls_1),且实际为正样本(cls_1)False Positive(FP):匹配结果正样本(cls_1),但实际为负样本(cls_1 or background)False Negative(FN):匹配结果为负样本(cls_other or backgroun),但实际为正样本(cls_1)True Negative(TN):匹配结果为负样本(cls_other or backgroun),且实际为负样本(cls_other or backgroun)
2 计算方法
基于YOLO源码实现
混淆矩阵计算(ConfusionMatrix)
- 函数
- process_batch:实现预测结果与真实结果的匹配,混淆矩阵计算
- plot:混淆矩阵绘制
- tp_fp:根据混淆矩阵计算
TP/FP
class ConfusionMatrix:
    # Updated version of https://github.com/kaanakan/object_detection_confusion_matrix
    def __init__(self, nc, conf=0.25, iou_thres=0.5):
        self.matrix = np.zeros((nc + 1, nc + 1))
        self.nc = nc  # number of classes
        self.conf = conf  # 类别置信度
        self.iou_thres = iou_thres  # IoU置信度

    def process_batch(self, detections, labels):
        """
        Return intersection-ove-unionr (Jaccard index) of boxes.
        Both sets of boxes are expected to be in (x1, y1, x2, y2) format.
        Arguments:
            detections (Array[N, 6]), x1, y1, x2, y2, conf, class
            labels (Array[M, 5]), class, x1, y1, x2, y2
        Returns:
            None, updates confusion matrix accordingly
        """
        if detections is None:
            gt_classes = labels.int()
            for gc in gt_classes:
                self.matrix[self.nc, gc] += 1  # 预测为背景,但实际为目标
            return

        detections = detections[detections[:, 4] > self.conf]  # 小于该conf认为为背景
        gt_classes = labels[:, 0].int()  # 实际类别
        detection_classes = detections[:, 5].int()  # 预测类别
        iou = box_iou(labels[:, 1:], detections[:, :4])  # 计算所有结果的IoU

        x = torch.where(iou > self.iou_thres)  # 根据IoU匹配结果,返回满足条件的索引 x(dim0), (dim1)
        if x[0].shape[0]:  # x[0]:存在为True的索引(gt索引), x[1]当前所有下True的索引(dt索引)
            # shape:[n, 3] 3->[label, detect, iou]
            matches = torch.cat((torch.stack(x, 1), iou[x[0], x[1]][:, None]), 1).cpu().numpy()
            if x[0].shape[0] > 1:
                matches = matches[matches[:, 2].argsort()[::-1]]  # 根据IoU从大到小排序
                matches = matches[np.unique(matches[:, 1], return_index=True)[1]]  # 若一个dt匹配多个gt,保留IoU最高的gt匹配结果
                matches = matches[matches[:, 2].argsort()[::-1]]  # 根据IoU从大到小排序
                matches = matches[np.unique(matches[:, 0], return_index=True)[1]]  # 若一个gt匹配多个dt,保留IoU最高的dt匹配结果
        else:
            matches = np.zeros((0, 3))

        n = matches.shape[0] > 0  # 是否存在和gt匹配成功的dt
        m0, m1, _ = matches.transpose().astype(int)  # m0:gt索引 m1:dt索引
        for i, gc in enumerate(gt_classes):  # 实际的结果
            j = m0 == i  # 预测为该目标的预测结果序号
            if n and sum(j) == 1:  # 该实际结果预测成功
                self.matrix[detection_classes[m1[j]], gc] += 1  # 预测为目标,且实际为目标
            else:  # 该实际结果预测失败
                self.matrix[self.nc, gc] += 1  # 预测为背景,但实际为目标

        if n:
            for i, dc in enumerate(detection_classes):  # 对预测结果处理
                if not any(m1 == i):  # 若该预测结果没有和实际结果匹配
                    self.matrix[dc, self.nc] += 1  # 预测为目标,但实际为背景

    def tp_fp(self):
        tp = self.matrix.diagonal()  # true positives
        fp = self.matrix.sum(1) - tp  # false positives
        # fn = self.matrix.sum(0) - tp  # false negatives (missed detections)
        return tp[:-1], fp[:-1]  # remove background class

    @TryExcept('WARNING ⚠️ ConfusionMatrix plot failure')
    def plot(self, normalize=True, save_dir='', names=()):
        import seaborn as sn
        plt.rc('font', family='Times New Roman', size=15)
        array = self.matrix / ((self.matrix.sum(0).reshape(1, -1) + 1E-9) if normalize else 1)  # normalize columns
        array[array < 0.005] = 0.00  # don't annotate (would appear as 0.00)

        fig, ax = plt.subplots(1, 1, figsize=(12, 9), tight_layout=True)
        nc, nn = self.nc, len(names)  # number of classes, names
        sn.set(font_scale=1.0 if nc < 50 else 0.8)  # for label size
        labels = (0 < nn < 99) and (nn == nc)  # apply names to ticklabels
        ticklabels = (names + ['background']) if labels else 'auto'
        with warnings.catch_warnings():
            warnings.simplefilter('ignore')  # suppress empty matrix RuntimeWarning: All-NaN slice encountered
            h = sn.heatmap(array,
                           ax=ax,
                           annot=nc < 30,
                           annot_kws={
                               'size': 20},
                           cmap='Reds',
                           fmt='.2f',
                           linewidths=2,
                           square=True,
                           vmin=0.0,
                           xticklabels=ticklabels,
                           yticklabels=ticklabels,
                           )
            h.set_facecolor((1, 1, 1))

            cb = h.collections[0].colorbar  # 显示colorbar
            cb.ax.tick_params(labelsize=20)  # 设置colorbar刻度字体大小。

        plt.xticks(fontsize=20)
        plt.yticks(fontsize=20)
        plt.rcParams["font.sans-serif"] = ["SimSun"]
        plt.rcParams["axes.unicode_minus"] = False
        ax.set_xlabel('实际值')
        ax.set_ylabel('预测值')
        # ax.set_title('Confusion Matrix', fontsize=20)
        fig.savefig(Path(save_dir) / 'confusion_matrix.png', dpi=100)
        plt.close(fig)

    def print(self):
        for i in range(self.nc + 1):
            print(' '.join(map(str, self.matrix[i])))


