神经网络——循环神经网络(RNN)
神经网络——循环神经网络(RNN)
文章目录
- 神经网络——循环神经网络(RNN)
-
- 一、循环神经网络(RNN)
- 二、循环神经网络结构
-
- 1、一对一(One to One)
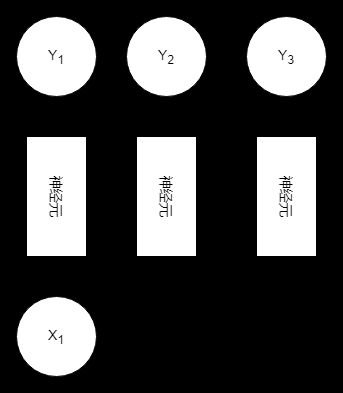
- 2、一对多(One to Many)
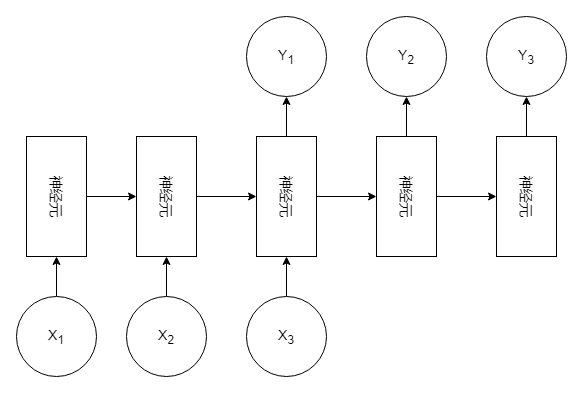
- 3、多对多(Many to Many)
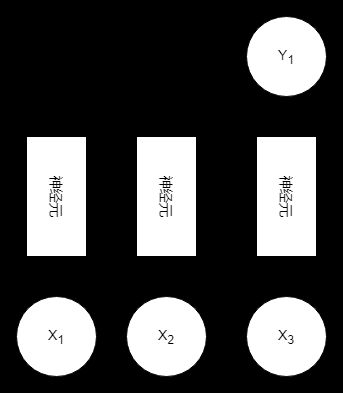
- 4、多对一(Many to One)
- 三、循环神经网络原理
- 四、RNN实战
-
- 1、时间序列预测
- 五、循环神经网络的弊端
一、循环神经网络(RNN)
循环神经网络(Recurrent Neural Network,简称RNN)是一种能够处理序列数据的神经网络模型。循环神经网络属于深度学习神经网络(DNN),与传统的前馈神经网络不同,RNN在处理每个输入时都会保留一个隐藏状态,该隐藏状态会被传递到下一个时间步,以便模型能够记忆之前的信息。
循环神经网络在自然语言处理、语音识别、机器翻译等任务上取得了很大的成功。它能够捕捉到输入序列的上下文信息,从而能够更好地处理序列数据的特点。
二、循环神经网络结构
1、一对一(One to One)
2、一对多(One to Many)
3、多对多(Many to Many)
4、多对一(Many to One)
三、循环神经网络原理
符号说明:
| 符号 | 说明 |
|---|---|
| X n X_n Xn | 输入内容 |
| Y n Y_n Yn | 输出内容 |
| U 、 V 、 W U、V、W U、V、W | 权重 |
| S n S_n Sn | 神经元 |
| c c c | 输出的个数 |
循环神经网络的一个特性是上一次的结果将会作为下一次的输入
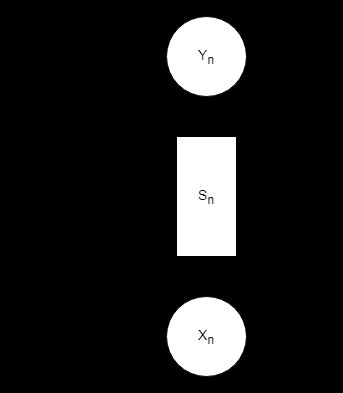
在输出层,通常使用 s o f t m a x softmax softmax函数对数据进行归一化处理。
Y n = s o f t m a x ( S n ) = e S n ∑ c = 1 c e S c \begin{aligned} Y_n&=softmax(S_n)\\ &= \frac{e^{S_n}}{\sum_{c= 1}^{c}e^{S_c}} \end{aligned} Yn=softmax(Sn)=∑c=1ceSceSn
由函数可知,此函数将数据限制在 [ 0 , 1 ] [0,1] [0,1]且和为 1 1 1。
在隐藏层中,常用 t a n h tanh tanh作为激活函数。根据循环神经网络的性质可以分析出
S n = t a n h ( U X n + W S n − 1 ) S_n=tanh(UX_n+WS_{n-1}) Sn=tanh(UXn+WSn−1)
根据公式可以得知
Y n = s o f t m a x ( ∑ n = 1 n t a n h ( U X n + W S n − 1 ) ) = e ∑ n = 1 n t a n h ( U X n + W S n − 1 ) ∑ c = 1 c e S c \begin{aligned} Y_n&=softmax(\sum_{n=1}^{n}tanh(UX_n+WS_{n-1}))\\ &=\frac{e^{\sum_{n=1}^{n}tanh(UX_n+WS_{n-1})}}{\sum_{c=1}^{c}e^{Sc}} \end{aligned} Yn=softmax(n=1∑ntanh(UXn+WSn−1))=∑c=1ceSce∑n=1ntanh(UXn+WSn−1)
四、RNN实战
1、时间序列预测
现在有2000-2013年成都一月份的平均温度数据,现在即将预测2014年的温度。
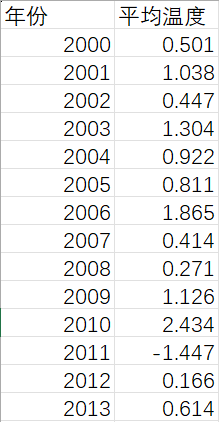
MATLAB代码如下:
% 日期数据
years = 2000:2013;
target_year = 2014;

% 温度数据
temperatures = [0.501, 1.038, 0.447, 1.304, 0.922, 0.811, 1.865, 0.414, 0.271, 1.126, 2.434, -1.447, 0.166, 0.614];

% 利用数据进行训练
training_years = years(1:14);
training_temperatures = temperatures(1:14);

% 创建简单的递归神经网络 (RNN) 模型
net = layrecnet(1,10);

% 调整输入数据的维度
input_seq = con2seq(training_temperatures');
target_seq = con2seq(training_temperatures');

% 在训练数据上训练模型
net = train(net, input_seq, target_seq);

% 预测2014年的温度
predicted_temperatures = sim(net, input_seq);

% 将 cell 类型的预测结果转换为数组类型
predicted_temperature_2014 = cell2mat(predicted_temperatures);

% 输出预测结果
disp(['2014年的预测温度为: ', num2str(predicted_temperature_2014(end))]);
figure;
hold on;
plot(training_years, training_temperatures, 'o-', 'LineWidth', 1.5, 'MarkerSize', 8, 'DisplayName', 'Training Data');
plot(target_year, predicted_temperature_2014(end), 'ro', 'MarkerSize', 10, 'DisplayName', 'Prediction');
xlabel('Year');
ylabel('Temperature');
legend('Location', 'best');
title('Temperature Prediction');
hold off;
最后得到2014年的预测温度,并获得一个预测图像。

有时候我们不一定只预测一年的数据。我们还可以预测2014-2018年每年的数据。
MATLAB代码如下:
% 温度数据
temperature = [0.501, 1.038, 0.447, 1.304, 0.922, 0.811, 1.865, 0.414, 0.271, 1.126, 2.434, -1.447, 0.166, 0.614];

% 准备训练数据
X = temperature(1:end-1);
Y = temperature(2:end);

% 数据预处理
X = X';
Y = Y';

% 构建RNN模型
hiddenUnits = 10; % 隐藏单元数量
net = layrecnet(1, hiddenUnits);

% 配置训练参数
net.trainParam.showWindow = false; % 不显示训练进度窗口
net.trainParam.epochs = 100; % 迭代次数

% 修改输入数据尺寸
X = con2seq(X);
Y = con2seq(Y);

% 转换数据为二维矩阵形式
X = cell2mat(X);
Y = cell2mat(Y);

% 将数据转换为时间序列数据
inputSize = size(X, 2);
outputSize = size(Y, 2);
X = num2cell(X', 1);
Y = num2cell(Y', 1);

% 训练RNN模型
net = train(net, X, Y);

% 预测并显示2014至2018年的温度和误差值
futureYears = 2014:2018;
predictedTemperature = [];
errors = [];

for i = 1:numel(futureYears)
    % 预测下一年的温度
    prediction = round(sim(net, lastInput), 3, 'significant');

    % 计算误差值
    error = abs(prediction - Y{i});

    % 添加到预测结果和误差列表
    predictedTemperature = [predictedTemperature, prediction];
    errors = [errors, error];

    % 更新输入
    lastInput = [lastInput(:, 2:end), prediction];

    % 显示当前年份、温度和误差值
    disp(['年份:' num2str(futureYears(i)) ',温度:' num2str(prediction) ',误差值:' num2str(error)]);
end

% 绘制训练集和预测结果
figure
hold on
plot(2000:2013, temperature, 'b')
plot(futureYears, predictedTemperature, 'r')
xlabel('年份')
ylabel('温度')
legend('训练数据', '预测数据')

% 计算平均绝对误差MAE
MAE = mean(errors);

% 输出平均绝对误差MAE
disp(['平均绝对误差MAE:' num2str(MAE)]);
根据MAE,选择误差合理的数据作为预测值。我选取一个MAE值为0.2422的预测值。图像如下:

五、循环神经网络的弊端
存在问题:
1、计算复杂度高:RNN的推理过程是逐步进行的,每一步都需要依赖前一步的结果。这导致了计算量较大,特别是在处理长序列时,时间和空间复杂度都会显著增加。
2、信息丢失:RNN的隐藏状态只能通过有限个时间步骤传递信息。长时间序列中重要的历史信息可能会被遗忘或丢失,从而影响预测的准确性。
解决方法:
采用长短期记忆网络(LSTM)、门控循环单元(GRU)等RNN变体。

