Pandas 统计分析基础----教材知识(2)
目录
Pandas 索引操作
重建索引
总结-----reindex的常用参数及其说明
更换索引
DataFrame 数据的查询与编辑
DataFrame 数据的查询
DataFrame 数据的编辑
Pandas 数据运算
算术运算
Series相加/减/乘/除/求余/(**)
DataFrame类型的数据相加/减/乘/除/求余/(**)
函数应用与映射
排序
汇总与统计
Pandas中常用的描述性统计方法
Pandas 索引操作
重建索引
说明:指对索引重新排序而不是重新命名,如果某个索引值不存在,则会引入缺失值。
| 方法 | 代码 | 说明 |
| 重建索引 | obj = pd.Series([1,-2,3,-4],index= ['a','b','c','d']) obj.reindex(['a','b','c','d','e']) |
|
| 重建索引时填充缺失值 | obj.reindex(['a','b','c','d','e'],fill_value = 0) | 若无fill_value = 0,则显示NaN |
| 缺失值向前填充 | obj1 = pd.Series(['blue','red','black'],index = [0,2,4]) obj1.reindex(np.arange(6),method = 'ffill') |
method = 'ffill'或'pad' |
| 缺失值向后填充 | obj1.reindex(np.arange(6),method = 'backfill') | method = 'bfill'或'backfill' |
| 对于DataFrame,reindex可以修改行(列)索引,或两个都修改。如果仅传入一个序列,则结果中的行会重建索引。 | ||
| DataFrame数据 | df4 = pd. DataFrame(np.arange(9).reshape(3,3),index = ['a', 'c', 'd'], columns = ['one', 'two', 'four']) print(df4) |
会默认对行索引重新排序 |
| reindex操作 | df4. reindex(index = ['a', 'b', 'c', 'd'], columns = ['one','two', 'three', 'four']) | |
| 传入fill_value=n填充缺失值 | df4.reindex(index = ['a', 'b', 'c', 'd'], columns = ['one', 'two', "three', 'four'], fill_value = 100) |
NaN值全部变为n值 |
总结-----reindex的常用参数及其说明
| 参数 | 说明 |
| index | 用于索引的新序列 |
| method | 插值(填充)方式 |
| fill_value | 缺失值替换值 |
| limit | 最大填充量 |
| level | 在 Multiindex的指定级别上匹配简单索引,否则选取其子集 |
| copy | 默认为True,无论如何都复制;如果为False,则新旧相等时就不复制 |
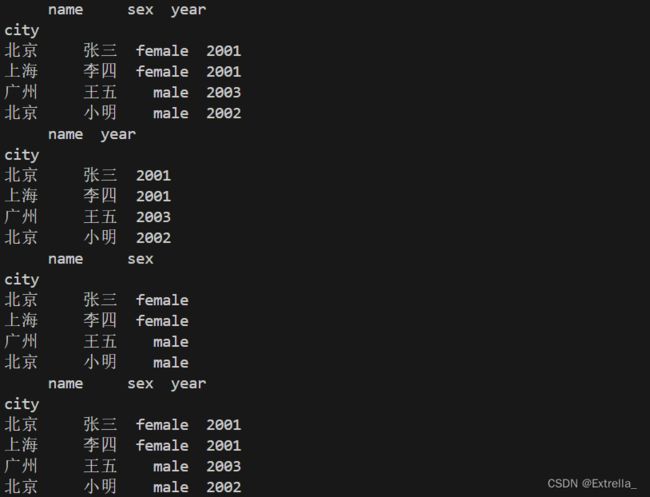
更换索引
说明:在DataFrame数据中,如果不希望使用默认的行索引,则可以在创建时通过Index参数来设置。有时希望将列数据作为索引,则可以通过set index方法来实现。
例题:
data = {
    'name':['张三','李四','王五','小明'],

    'sex':['female','female','male','male'],

    'year':[2001,2001,2003,2002],

    'city':['北京','上海','广州','北京']

}

df1 = pd.DataFrame(data)
df2 = df1.set_index('city')
print(df2)
DataFrame 数据的查询与编辑
DataFrame 数据的查询
| 方法 | 代码 | 说明 |
| 选取列 | w1 = df2[['name','year']] display(w1) #df选择非‘int64’的类型的列表示 display(df2.select_dtypes(exclude = 'int64').head()) #选择‘int64’和‘object’类型的列显示 df2.select_dtypes(include = ['int64','object']).head() display(df2) |
import print as display 在选取列时不可以使用切片方式 |
| 选取行 | print('显示前2行:\n',df1[:2]) print('显示2~3行:\n',df1[1:3]) |
通过行索引或行索引位置的切片形式选取数据 |
| (变量名).head() | 默认获取前5行 | |
| (变量名).head(n) | 获取前n行 | |
| (变量名).tail() | 默认获取后5行 | |
| (变量名).tail(n) | 获取后n行 | |
| (变量名).sample(n) | 随机抽取n行显示 | |
| (变量名).sample(frac = 0.6) | 随机抽取60%的行 | |
| 选取行和列 | display(df2,loc[:,['name','year']]) display(df2.loc[['北京','上海'],['name','year']]) display(df2.loc[df2['year'] >= 2002,['name','year']]) |
DataFrame.loc-----名称 行索引名称或条件,列索引名称 |
| display(df2.loc[df2['year'].isin(['2001','2003'])]) | 对指对条件(查询2001与2003的数据)的数据进行提取 |
|
| print(df2.iloc[:,2]) print(df2.iloc[[1,3]]) print(df2.iloc[[1,3],[1,2]]) |
DataFrame.iloc-----切片 行索引位置,列索引位置 |
|
| pd.DataFrame.query(self,expr,inplace=False,**kwargs) 例子:display(df2.query('year>2001')) display(df2.query('year>2001&year<2003')) |
参数expr:要评估的查询字符串 参数kwargs:dict的关键字参数 |
|
| 布尔选择 | df3 = pd.DataFrame({'price':[1.99,3,5,0.5,3.5,5.5,3.9]}) print(df3[(df3.price>=2)&(df.price<=4)]) |
对DataFrame的数据进行布尔选择,常用的逻辑运算符为 (!=)(&)(|)等,使用时必须在逻辑运算符前后加“(”和“)” |
选取列运行结果
DataFrame 数据的编辑
| 方法 | 代码 | 说明 |
| 增加数据(append,insert) | data1 = {'city':'兰州',''name':'李红','year':2005,'sex':'female'} df1.append(data1,ignore_index = Ture) |
append尾添加 ignore_index设置是否忽略原index |
| df1['score'] = [85,78,96,80] df1.insert(1,'no',['001','002','003','004']) print(df1) |
insert指定新增列的位置 | |
| 删除数据 (drop) |
df1.drop('广州',inplace = Ture) df1.drop('sex',axis = 1,inplace = Ture) |
axis:0行1列 默认不修改原数据 inplace = Ture表示修改 |
| 修改数据 (replace) |
DataFrame.replace(to_replace = None,value = None,inplace = False,limit = None,regex = False,method = 'pad') 例如:DataFrame.replace('B:'E','C':'F') |
to_replace表示替换值 value表示替换后的值 原数据被修改,无法撤销 |
| 修改列名 (rename) |
df1.rename(columns = {'no':'number'},inplace = Ture) |
Pandas 数据运算
算术运算
说明:如果有相同索引则进行算术运算,没有会数据对齐,引入NaN
Series相加/减/乘/除/求余/(**)
例题:
import numpy as np
import pandas as pd

obj1 = pd.Series([5.1,-2.6,7.8,10],index =  ['a','b','g','f'])
print('obj1:\n',obj1)
obj2 = pd.Series([2.6,-2.8,3.7,-1.9],index = ['a','b','g','h'])
print('obj2:\n',obj2)
print(obj1+obj2)
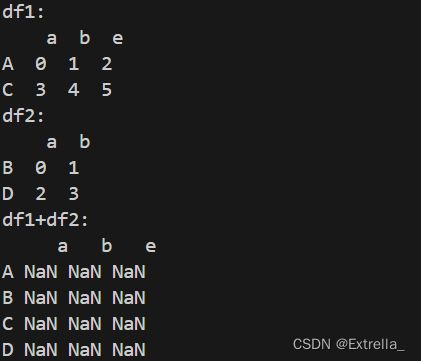
DataFrame类型的数据相加/减/乘/除/求余/(**)
例题:
import numpy as np
import pandas as pd

a = np.arange(6).reshape(2,3)
b = np.arange(4).reshape(2,2)
df1 = pd.DataFrame(a,columns = ['a','b','e'],index = ['A','C'])
print('df1:\n',df1)
df2 = pd.DataFrame(b,columns = ['a','b'],index = ['B','D'])
print('df2:\n',df2)
print('df1+df2:\n',df1+df2)
函数应用与映射
| 方法 | 代码 | 说明 |
| map函数 | data = {'fruit':['apple','grape','banana'],'price':['30元','43元','28元']} df1 = pd.DataFrame(data) print(df1) def f(x): return x.split('元')[0] df1['price'] = df1['price'.map(f)] print('修改后的数据为:\n',df1) |
将函数套用到Series的每个元素中 |
| apply函数 | df2 = pd.DataFrame(np.random.randn(3,3),columns = ['a','b','c'], index = ['app','win','mac']) print(df2) print(df2.apply(np.mean)) |
将函数套用到DataFrame的行与列上(axis决定) |
| applymap函数 | df2 = pd.DataFrame(np.random.randn(3,3),columns = ['a','b','c'],index = ['app','win','mac']) print(df2) print(df2.applymap(lambda x:'%.3f'%x)) |
将函数套用到DataFrame的每个元素上 |
排序
| Series | sort_index()----索引排序 | 默认升序,降序加参数ascending = False |
| sort_values()----值排序 | ||
| DataFrame | df2.sort_values(by = 'a') | 指定轴方向,使用sort_index函数对行或列索引进行排序 列排序,则将列名传给by参数 |
汇总与统计
| 数据汇总 | df2.sum() | 队每列进行求和汇总 |
| df2.sum(axis = 1) | 按轴进行行汇总 | |
| 数据描述与统计 | df2.describe() | 输出count,mean,atd,min,25%,50%,75%,max数据 |
Pandas中常用的描述性统计方法
| 方法 | 说明 | 方法 | 说明 |
| min | 最小值 | max | 最大值 |
| mean | 均值 | ptp | 极差 |
| median | 中位数 | std | 标准差 |
| var | 方差 | cov | 协方差 |
| sem | 标准误差 | mode | 众数 |
| skew | 样本偏度 | kurt | 样本峰度 |
| quantile | 四位分数 | count | 非空值数目 |
| describe | 描述统计 | mad | 平均绝对离差 |
补充:频数统计表
nuique获取不重复的数组
value_counts实现频数统计