Highcharts:功能强大、开源、美观、图表丰富、兼容绝大多数浏览器的纯js图表库
Highcharts是一款纯javascript编写的图表库,能够很简单便捷的在Web网站或Web应用中添加交互性的图表,Highcharts目前支持直线图、曲线图、面积图、柱状图、饼图、散点图等多达18种不同类型的图表,可以满足对Web图表的任何需求 !
Highcharts中文网:http://www.hcharts.cn/index.php
Highcharts中文教程:http://www.hcharts.cn/docs/index.php?doc=start
Highcharts API文档:http://www.hcharts.cn/api/index.php
<!DOCTYPE html PUBLIC "-//W3C//DTD XHTML 1.0 Transitional//EN" "http://www.w3.org/TR/xhtml1/DTD/xhtml1-transitional.dtd">
<html xmlns="http://www.w3.org/1999/xhtml">
<head>
<meta http-equiv="Content-Type" content="text/html; charset=gb2312" />
<title>无标题文档</title>
 <script type="text/javascript" src="http://cdn.hcharts.cn/jquery/jquery-1.8.3.min.js"></script>
  <script type="text/javascript" src="http://cdn.hcharts.cn/highcharts/highcharts.js"></script>
  <script type="text/javascript" src="http://cdn.hcharts.cn/highcharts/exporting.js"></script>
</head>

<body>
 <div id="container" style="min-width:700px;height:400px"></div>
</body>
</html>
<script>
$(function () {
$('#container').highcharts({ //图表展示容器,与div的id保持一致
title: {
useHTML: true,
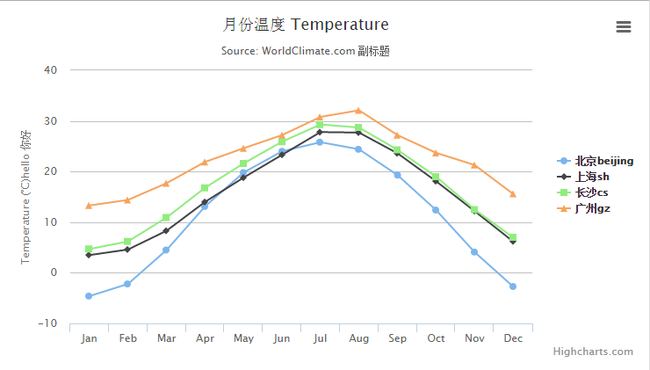
text: "月份温度 Temperature | <a href='http://123.sogou.com/sub/tianqi.html?d=7' target='_blank'>七日天气</a>",//标题 标题
x: -20 //center
},
subtitle: {
text: 'Source: WorldClimate.com 副标题',//副标题
x: -20
},
xAxis: {
categories: ['Jan', 'Feb', 'Mar', 'Apr', 'May', 'Jun','Jul', 'Aug', 'Sep', 'Oct', 'Nov', 'Dec'],
tickmarkPlacement: 'on',
gridLineColor:'#C0C0C0',
gridLineDashStyle:'Solid',//Dash,Dot,Solid
gridLineWidth:1,
plotLines:[{//标示线plotLines
color:'red', //线的颜色,定义为红色
dashStyle:'LongDashDot',//标示线的样式,默认是solid(实线),这里定义为长虚线
// Solid, ShortDash, ShortDot,ShortDashDot,ShortDashDot,Dot,Dash,LongDash,DashDot,LongDashDot,LongDashDotDot
value:3, //定义在那个值上显示标示线,这里是在x轴上刻度为3的值处垂直化一条线
width:2 //标示线的宽度,2px
}]
},//横坐标
yAxis: {
title: {
text: 'Temperature (°C) hello 你好'//纵坐标标题
},
plotLines: [{//标示线plotLines
value: 0,//定义在那个值上显示标示线,这里是在y轴上刻度为0的值处垂直化一条线
width: 1,//背景横线宽度
color: '#808080'//纵坐标背景颜色
}]
},//纵坐标
tooltip: {//数据提示框。当鼠标悬停在某点上时,以框的形式提示改点的数据,比如该点的值,数据单位等。数据提示框内提示的信息完全可以通过格式化函数动态指定。
valueSuffix: '°C滴答滴答' //当鼠标悬置数据点时的格式化提示
},
credits:{//版权信息
enable:true,
text:'版权所有',
href:'http://tiankongtingmei.iteye.com/',
position:{
align:'right',
x:-10,
verticalAling:'bottom',//垂直对其底部
y:-5
},
style:{
cursor:'pointer',//鼠标
color:'red',
fontSize:'10px'
}
},
legend: { //【图例】位置样式 图例。用不同形状、颜色、文字等 标示不同数据列,通过点击标示可以显示或隐藏该数据列。
layout: 'vertical', //【图例】显示的样式:水平(horizontal)/垂直(vertical)
align: 'right',
verticalAlign: 'middle',//垂直对齐居中
borderWidth: 0
},
series: [{ //数据列。图表上一个或多个数据系列,比如曲线图中的一条曲线,柱状图中的一个柱形。
name: '北京beijing', //注释 图例名称
type:'line',//line直线图 spline曲线图 area面积图 areaspline曲线面积图 arearange面积范围图 areasplinerange曲线面积范围图 // column柱状图 柱状范围图columnrange bar条形图 pie饼图 scatter散点图 boxplot箱线图 bubble气泡图
// funnel漏斗图 仪表图gauge 瀑布图waterfall 雷达图polar errorbar误差线图
data: [ - 4.6, -2.2, 4.5, 13.1, 19.8, 24.0, 25.8, 24.4, 19.3, 12.4, 4.1, -2.7]
},
{
name: '上海sh',
data: [3.5, 4.6, 8.3, 14.0, 18.8, 23.3, 27.8, 27.7, 23.6, 18.1, 12.2, 6.2]
},
{
name: '长沙cs',
data: [4.7, 6.2, 10.9, 16.8, 21.6, 25.9, 29.3, 28.7, 24.3, 19.0, 12.5, 7.0]
},
{
name: '广州gz',
data: [13.3, 14.4, 17.7, 21.9, 24.6, 27.2, 30.8, 32.1, 27.2, 23.7, 21.3, 15.6]
}
]
});
});
/*
Exporting
导出功能按钮。通过引入exporting.js即可增加图表导出为常见文件功能。
PlotLines
标示线(或辅助线)。可以在图表上增加一条标示线,比如平均值线,最高值线等。
PlotBands
标示区域(分辨带)。可以在图表添加不同颜色的区域带,标示出明显的范围区域。*/
</script>
效果图eg: