How to debug crashes and hangs (posted by Kirill Osenkov, from MSDN blog)
How to debug crashes and hangs
At my job on the C# IDE QA team I've learned some useful things about debugging in Visual Studio, which I'd like to summarize in this post. Although the screenshots were made using Visual Studio 2008 SP1, this pretty much applies to other versions of VS as well.
Rich debugging support
When you develop your C# application and hit F5, the target process (your program) gets started, and then the Visual Studio process attaches the debugger to the process where your code is running. This way, you can break into the debugger and VS will provide you with all sorts of rich debugging support - current statement highlighting, call stack, watches, locals, immediate window, Edit-and-Continue and so on.
More importantly, if your application throws an exception or crashes, the debugger will intercept that and provide your with all the information about the exception.
As a side note, in Visual Studio there is a way to run your code without attaching the debugger - the shortcut is Ctrl+F5. Try throwing an exception in your code when using F5 and Ctrl+F5 to feel the difference.
throw null;
By the way, my favorite way to artificially throw exceptions is throw null; I just love the fact that it throws a NullReferenceException because it can't find the exception object and nevertheless does exactly what I want it to do :)
Crashes and the Watson dialog
What if a program crashes or throws an exception, which you don't have source code for? Moreover, you didn't start the program using F5, but the operating system launched the process. I remember that before coming to Microsoft, the only thing I could do about some application crashing was to express my disappointment about the fact (usually in Russian). Now I don't feel helpless anymore, because I've learned a couple of tricks. As an example for this we'll crash Visual Studio itself and then debug the crash.
How to crash Visual Studio?
Viacheslav Ivanov reported an interesting crashing bug in our language service recently. Save all your work and then paste this code in a C# Console Application and change 'object' to 'int':
using System;

static class Program
{
    static void Main()
    {
        ITest<object> test;
        test.Test((object /* and now change the argument type to "int" */ i) => { });
    }
}

public interface ITest<T> { }

public static class Extensions
{
    public static void Test<T, I>(this ITest<T> test, Action<ITest<I>> action) { }
}
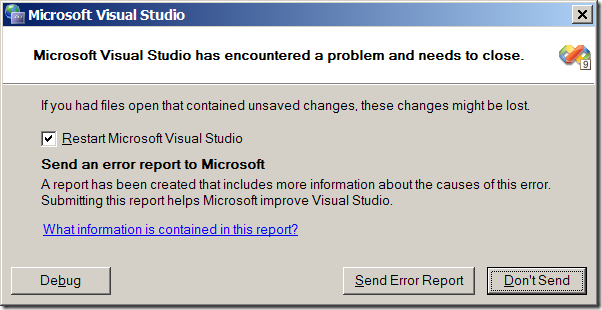
What you will see is the Watson dialog:
Given this chance, I'd highly recommend everyone to click "Send Error Report" if you ever see this dialog for Visual Studio. Many people "Don't Send" and frankly I don't understand why not. There is no personal information being sent, and we don't want your personal information anyway, honest. What we want is a call-stack and minidump, if possible, so if you want us to fix the product to make it more stable in the future, you will greatly help us if you send us the Error Report. By the way, we usually fix most (if not all) crashes that come in through this dialog, so the chances that we'll fix the crash you report using the dialog are actually pretty high. For example, we've already fixed the bug mentioned above and it works just fine in current builds.
Attaching a debugger
So what can you do if an application crashes or hangs? You can attach the debugger to a running process, even if it has already crashed. The code is still being executed (the main thread of the crashed application is usually pumping messages for the error dialog). You can either choose "Debug" on the Watson dialog, or (what I usually do) is start a new instance of Visual Studio myself and attach to the process manually, without dismissing the Watson dialog.
Note: if the debuggee process crashes and you attach the debugger after the fact, you'll have to manually break into the debugger by pushing the "Pause" button. If the debugger was already attached at the moment of the crash, then it will offer you to break or continue.
You can attach the Visual Studio debugger to a running process by choosing Tools | Attach To Process (Ctrl+Alt+P):
You will see the Attach to process dialog:
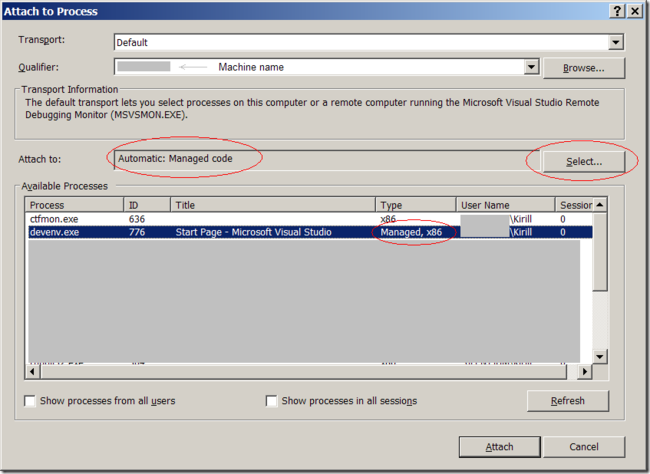 Interesting things to note here are the Attach to: selection. Since Visual Studio is a mixed-mode managed/native application, to get call stacks for both managed and native parts, you'd want to attach to both of them (by clicking Select...):
If you select both Managed and Native, you'll get richer debugging information about your callstacks - this is recommended.
Note: if you want to enable mixed-mode debugging (managed+native) for the application that you have source code for, go to project properties of the startup project, and on the Debug tag select "Enable unmanaged code debugging". Then the debugger will automatically attach using mixed-mode.
Finally, select the process from the list which you'd like to attach to (in our example, it will be devenv.exe) and click Attach. Notice that the process of the debugger itself is not shown in the list, that's why you don't see two devenv.exe in the list.
Remote Debugging
What many people don't know is that VS can be used to debug a process running on another machine on the network. To do this, you just need to start the Visual Studio Remote Debugging Monitor on the same machine with the process you want to debug:
The remote debugging monitor will listen to debugger connections on the other machine and you'll be able to attach the debugger using the Transport and Qualifier fields on the Attach to process dialog:
You can find more detailed information about Remote Debugging in MSDN and on the internet.
Set Enable Just My Code to false
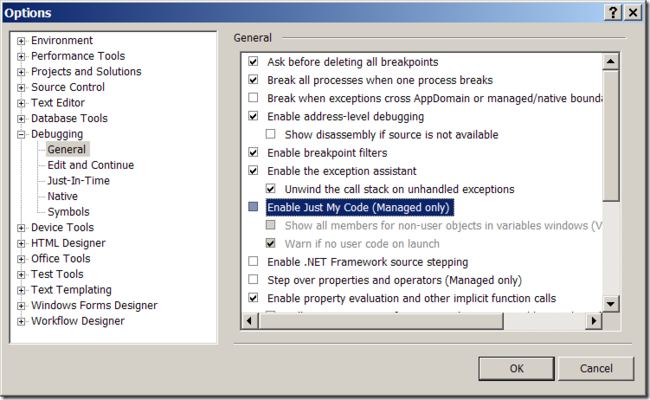
One very important option in Visual Studio is "Enable Just My Code", which is set to true by default. To be able to see more information on the callstacks instead of just "Non-user code", you need to go to Tools | Options and disable this option:
I usually do this right after I install Visual Studio, so that I can always debug into "not my code".
Other interesting options on this page are:
- Enable .NET Framework source stepping - in case you'd like to step into the .NET framework source code
- Enable Source Server support
- Step over properties and operators (Managed only) - won't step in to property getters, operators, etc. - this is new in VS 2008 SP1
- Require source files to exactly match the original version - in case you don't have the source files for the exact .pdb symbol file, but still have a close version of the source code
Break on first chance exceptions
One very useful option in the debugger is the ability to break whenever a first-chance exception is being thrown. A first-chance exception is an exception that might be caught by the program itself later in some surrounding catch block. First-chance exceptions are usually non-fatal and handled (or swallowed) by the user, so they might not even be visible to the end user during normal execution. However, if a first-chance exception is not handled in the code and bubbles up to the CLR/OS, then it becomes a crash.
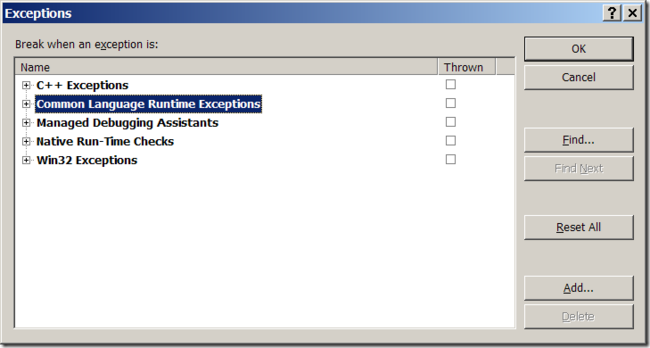
So, to break on first-chance exceptions, you can go to Debug | Exceptions to invoke the Exceptions dialog:
Here you can put a checkmark on Common Language Runtime Exceptions for the debugger to break every time a managed exception is thrown. This way you will see more hidden exceptions, some of them originating deep in the .NET framework class library. Sometimes there are so much first-chance exceptions that you can become overwhelmed, but they are incredibly useful to get to the root cause of the problem, because the debugger will show exactly where the exception originated preserving the original surrounding context. Another great advantage of breaking on first-chance exceptions is that the call stack is not unwound yet and the problem frame is still on the stack.
Debugging tool windows
OK, so now that we know how to attach a debugger and how to set the debugger options, let's see what happens after we've attached a debugger. For our exercise, you can open two instances of Visual Studio, attach the second instance's debugger to the first one, and then crash the first one using the lambda-expression crash code above. Instead of the Watson dialog on the debuggee process, you will see the following window in the debugger:
Now you have the chance to break and see where the exception happened. Continue is useful if the exception is actually a first-chance exception and you'd like to pass it on to user code to handle it. Let's hit Break and examine what tool windows are available under debugger.
Processes window
All the debugger windows are available from menu Debug | Windows. The Processes window shows the list of processes that the debugger is currently attached to. A nice trick is that you can actually attach to multiple processes at the same time. Then you can use this window to switch the "current" debuggee process and all other tool windows will update to show the content of the "current" process.
Note: on our team, we use this window a lot, because our tests run out-of-process. Our test process starts Visual Studio in a separate process and automates it using DTE, remoting and other technologies. Once there is a failure in the test, it's useful to attach to both the test process and the Visual Studio process under test. The most fun part is when I was debugging a crash in the debugger, and attached the debugger to the debugger process that is attached to some other process. Now if the debugger debugger crashes on you on the same bug, then you're in trouble ;) Sometimes I definitely should blog more about the fun debugging stories from my day-to-day job. But I digress.
Threads
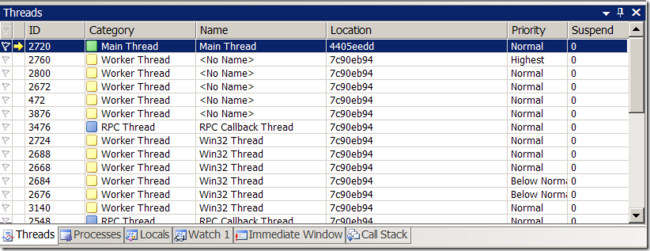
As we all know, processes have multiple threads. If you break into a debuggee process, you will most likely end up with a list of threads that were active at the moment when you did break. Main thread is the green one - this is the UI thread of your application (in our example, Visual Studio). Main thread executes the application message loop, and is pumping the windows messages for the application's UI. If a message box or a dialog is shown, you will see this dialog's message loop on the main thread.
To switch threads, double-click the thread name that you're interested in. In most of the cases you'll be interested in the main thread. But if you start your own threads, give them a name so that they are easy to find in the threads list.
Call stack
Every thread has a call stack. Call stack is probably the most important thing you'd like to know about a crash - what was the sequence of function calls that lead to a crash? If the program is hanging, you'd like to know what function is it hanging in and how did it get there. Oftentimes by just glancing at a callstack you immediately know what's going on. "Is this callstack familiar?" or "Who is on the callstack?" is probably the question we ask most often during the bug triage process.
Anyway, here's the call stack window:
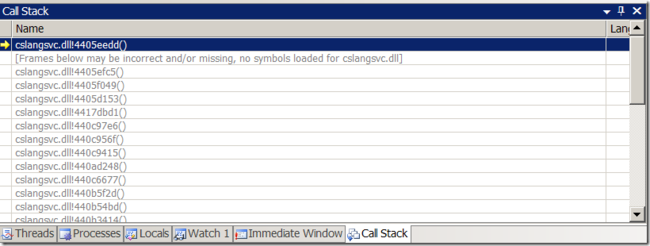
In our example we see that the C# language service module is on the stack (.dlls and .exes are called "modules" in the debugging world).
However instead of function names from cslangsvc.dll we see the addresses of the procedures in memory. This is because the symbols for the cslangsvc.dll module are not loaded. We'll look into how to load symbols in a moment.
Modules
The Modules window shows a list of .dlls and .exes loaded into the debuggee process:
There are multiple ways to load symbols for a given module. You can right-click on a module for a list of options:
Symbols for modules are stored in .pdb files and are produced with every debug build of the binary. pdb files contain mapping from compiled binaries back to the original source code, so that the debugger can display rich information (function names, source code locations, etc.) for the binary being debugged. Without symbols, debugging is only possible at the assembly level and registers window, you can't map the binaries back to the source code.
Symbols
A very useful dialog is the Tools | Options | Debugging | Symbols:
Here you can set paths where to look for the .pdb files. Normally, the .pdb files will be directly next to the binaries, in which case they are usually found and loaded automatically. Loading symbols takes some time, so Visual Studio supports caching symbol files to some directory. Also, if you don't want all the symbols for all the binaries loaded (it can take a while), you can check the checkbox "Search the above locations only when symbols are loaded manually". Load symbols from Microsoft symbol servers provides symbols for Microsoft products, such as Windows and Visual Studio. You can load symbols from here, or also from the Modules or Call Stack windows, by right-clicking on a module and choosing Load Symbols From. Since we're debugging into Visual Studio, the symbols are located on the Microsoft Symbols servers:
When we load public symbols, the following little dialog is showing:
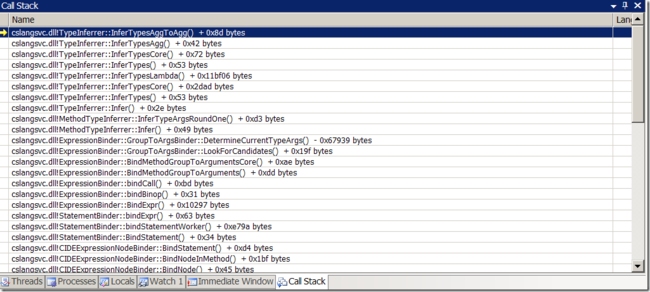
After we've loaded the symbols for cslangsvc.dll we notice that the Call Stack window is now much more informative:
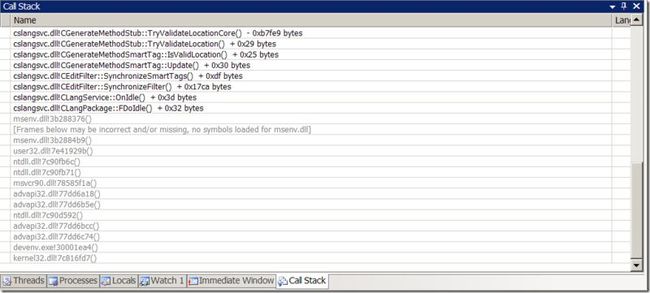
Given this call stack, anyone of our developers will now easily be able to pinpoint the problem. In our example we see that the problem happens when we try to show the Smart Tag for the Generate Method refactoring:
As you see, there are more modules for which the symbols haven't been loaded yet. You can load the symbols for those modules by right-clicking their stack frame and choosing Load Symbols From. Loading all the symbols is usually recommended for more detailed information.
That is why the call stack is so precious during bug reports. To save the call stack, you can Ctrl+A and Ctrl+C to copy all the stack into the clipboard. When you click Send Error Report in the Watson dialog, the call stack is included in the error report.
Also you see that the call stack is not very useful without the symbols - it's the symbols + the callstack that provide rich information about the crash.
Minidump
Another very useful information that you can provide about the crashed process is the memory dump (heap dump, minidump) - this is basically a snapshot of the memory state of the crashed process. To create a minidump, go to Debug | Save Dump As. Visual Studio will offer you to save the dump to a location on disk, and an option to just save the Minidump or Minidump with Heap:
Minidump with Heap will save more information than just the minidump, but will take a whole lot more disk space (for Visual Studio - possibly hundreds of megabytes - depending on the process working set size during the crash).
Those are the three components that we usually send to our developers during crash bug reporting:
- Call stack
- Symbols
- Minidump with heap
In most cases, they are able to understand the problem given this information. A list of repro steps is usually even better, because they can reproduce the problem themselves and enable first-chance exceptions to break early into the problem area.
Debugging hangs
If an application hangs, you can attach the debugger to it and hit break to see what thread and what call stack blocks execution. Usually looking at the call stack can give you some clues as to what is hanging the application. Debugging hangs is no different than debugging crashes.
Microsoft shares customer pain
Finally, I'd recommend everyone to watch this video:
Conclusion
In this post, I've talked about some things worth knowing for effective debugging sessions:
- Turning off "Enable just my code"
- Attaching the debugger using Tools | Attach To Process
- Selecting Managed, Native for mixed-mode debugging or Enable unmanaged code debugging
- Attaching to multiple processes
- Selecting processes and threads
- Breaking on first-chance exceptions using the Debug | Exceptions dialog
- Picking the right thread
- Loading symbols
- Viewing the call stack
- Saving the minidump file
Do let me know if you have feedback or corrections about this information.
Link: http://blogs.msdn.com/kirillosenkov/archive/2008/12/07/how-to-debug-crashes-and-hangs.aspx
