喂数据给graphite
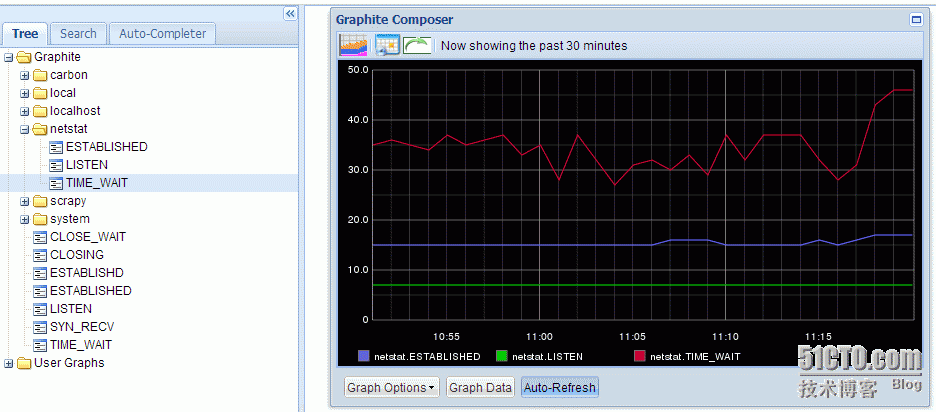
初学graphite,我想把统计的连接数以图的形式展现出来,由于连接数的种类的不止一种,所以不能用简单的nc发送,需要发送给carbon。
参考官网http://graphite.readthedocs.org/en/latest/feeding-carbon.html
改了下example-client.py
import sys
import time
import os
import subprocess
from socket import socket
CARBON_SERVER = '127.0.0.1'
CARBON_PORT = 2003
delay = 60
if len(sys.argv) > 1:
  delay = int( sys.argv[1] )
def netstat():
    command = "netstat -a|awk '/tcp/{++s[$NF]}END{for (i in s)print i,s[i]}'"
    process = subprocess.Popen(command, stdout=subprocess.PIPE, shell=True)
    os.waitpid(process.pid, 0)
    output = process.stdout.read().replace(',', ' ').strip().split()
    return output
sock = socket()
try:
  sock.connect( (CARBON_SERVER,CARBON_PORT) )
except:
  print "Couldn't connect to %(server)s on port %(port)d, is carbon-agent.py running?" % { 'server':CARBON_SERVER, 'port':CARBON_PORT }
  sys.exit(1)
while True:
  now = int( time.time() )
  lines = []
  #We're gonna report all three loadavg values
  net = netstat()
  lines.append("netstat.%s %s %d" % (net[0],net[1],now))
  lines.append("netstat.%s %s %d" % (net[2],net[3],now))
  lines.append("netstat.%s %s %d" % (net[4],net[5],now))
  message = '\n'.join(lines) + '\n' #all lines must end in a newline
  print "sending message\n"
  print '-' * 80
  print message
  print
  sock.sendall(message)
  time.sleep(delay)
代码中"netstat.%s %s %d" 为schema的命名方案。
再编辑storage-schemas.conf,加入以下内容
[netstat]
pattern = ^netstat\.
retentions = 3s:1d
pattern 是一个正则表达式,它将匹配以netstat开头的数据。
retentions 我的理解是表示每个数据点保存3s,这样的数据点一共保存1天
参考http://graphite.readthedocs.org/en/latest/config-carbon.html
最后启动carbon-cache.py
执行example-client.py 就实现了我要的效果
