matlab绘制世界地图的脚本
matlab的mapping toolbox功能真是强大,远非GrADS和NCL可以相提并论的,就是帮助文档太多,下载的PDF格式的帮助说明都800多页了.
当然学习的关键还是在于实践,下面是我绘制世界地图的示例脚本:
%%
clear;clc;close all
maps %查看当前可用的地图投影方式

%%  导入数据,全球海岸线
load coast

%% 绘图
axesm robinson
patchm(lat,long,'g');
 %% 设置属性
setm(gca);%查看当前可以设置的所有图形坐标轴(map axes)的属性
setm(gca,'Frame','on');%使框架可见
getm(gca,'Frame');%使用getm可以获取指定的图形坐标轴的属性
setm(gca,'Grid','on');%打开网格
setm(gca,'MLabelLocation',60);%标上经度刻度标签,每隔60度
setm(gca,'MeridianLabel','on');%设置经度刻度标签可见
setm(gca,'PLabelLocation',[-90:30:90])%标上经度刻度标签,[-90:30:90]
setm(gca,'ParallelLabel','on');%设置经度刻度标签可见
setm(gca,'MLabelParallel','south');%将经度刻度标签放在南方,即下部
setm(gca,'Origin',[0,90,0]);%设置地图的中心位置和绕中心点和地心点的轴旋转角度[latitude longitude orientation]
setm(gca,'PLabelMeridian',90);%将纬度标签放置在经度为90度的地方
绘制的图像如下:
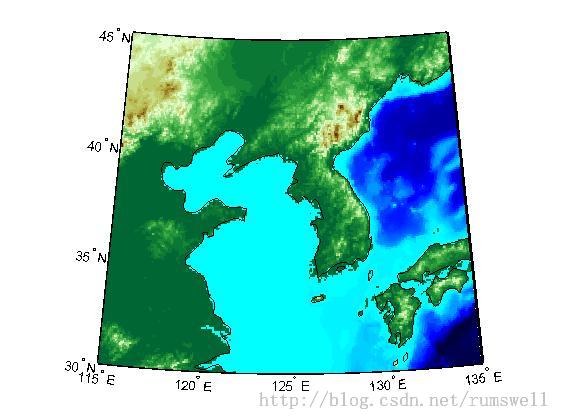
其实一般使用worldmap+geoshow比较方便,下面是两个例子:
load korea
figure;
worldmap(map, refvec)

% Display the Korean data grid as a texture map.
geoshow(gca,map,refvec,'DisplayType','texturemap');
demcmap(map)

% Display the land area boundary as black lines.
S = shaperead('landareas','UseGeoCoords',true);
geoshow([S.Lat], [S.Lon],'Color','black');
绘制的图形如下:
下面再给一个例子:
%%
clear;clc;close all
load geoid
% Create a figure with an Eckert projection.
figure
axesm eckert4; %注意axesm后面的m了吗?,可以使用maps命令查看所有的地图投影的方式,然后选一个
framem; gridm;%显示框架和网格线,注意后面都多了个m,表示map
axis off %关闭外部坐标轴,外部坐标轴不同于map axes

% Display the geoid as a texture map.
geoshow(geoid, geoidrefvec, 'DisplayType', 'texturemap');

% Create a colorbar and title.
hcb = colorbar('southoutside');
set(get(hcb,'Xlabel'),'String','EGM96 Geoid Heights in Meters.')

% Mask out all the land.
geoshow('landareas.shp', 'FaceColor', 'white');
绘制的图形如下:

