JMeter Test Plan的组成部分之Listeners
Each Listener displays the response information in specific way. For example, in order to view the graph form of the statistical data of the response time, you may want to use a "Aggregate Graph" Listener. Likewise, to view the statistical report on
the same response data in a table form, you may want to add a "Summary Report" or "Aggregate Report" Listener. You can choose the form in which you would like to view the requests by selecting any of these Listeners, but they all write the same raw data to the output file with a .jtl extension.
Listeners provide means to view, save, and read saved test results. All Listeners that save data into the same file shows the same data differently.
Some features common to all Listeners are:
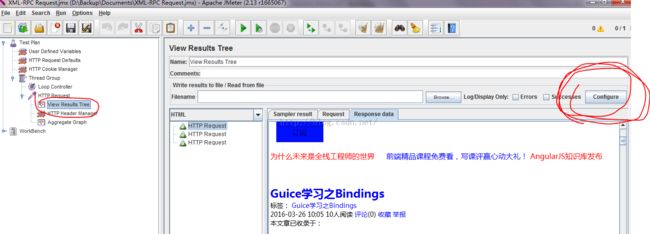
Configure button: Use the "Configure" button to choose the information to write to the file for later use, or whether to save (with .jtl extension) in XML or CSV format—the latter being smaller and less detailed. This button is found in each
Listener added to the Test Plan tree.
Once selected, the Save Configuration Window will appear as shown:


A Listener can use a lot of memory if there are a lot of Samples for which it is recording data.
Jmeter will slow down if you have many listeners active. Therefore, use a minimum set of the most appropriate listeners.
One way to use the least memory possible is to save in the default CSV format and to use Simple Data Writer Listener.
You may also change the default file format to save to XML, by editing the jmeter.properties file. Look for this entry: jmeter.save.saveservice.output_format=csv and simply change csv to xml if you opt for more detailed information.
The following list consists of all the Listeners JMeter provides:
- Sample Result Save Configuration
- Graph Full Results
- Graph Results
- Spline Visualizer
- Assertion Results
- View Results Tree
- Aggregate Report
- View Results in Table
- Simple Data Writer
- Monitor Results
- Distribution Graph (alpha)
- Aggregate Graph
- Mailer Visualizer
- BeanShell Listener
- Summary Report
