惊叹计算机执行速度的提升---以n Queens 问题为例
1 介绍
实现了书《Data Structures and Program design in C++》(Robert L. Kruse and Alexander J. Ryba, 2000)中的188页的基于回溯策略的递归算法solve_from,该算法能够计算n Queens问题的解。选择不同的n作为棋盘大小,可以得出不同棋盘大小的Queens问题的解即运行时间。
该书出版时间为2000年,那么使用的计算机大概为1999年左右的,该书给出了运行的结果数据;我在我的电脑上采用同样的代码和算法,选择同样的n也运行得到了相应的数据。通过二者数据的对比,可以看出计算机运行时间的提示 (我的电脑时2011年12份买的)。
2 主程序及我的电脑环境
2.1 主程序
由于书中的主程序没有给出统计所以解和运行时间的代码,于是我相应更改了主程序源代码如下:
#include <iostream>
#include <time.h>
#include "queens.h"

int sol_num =0;
void solve_from(Queens &configuration);

int main(){
    int board_size;
    clock_t start_time, end_time;
    cout<<"what is the size of the board?" << flush;
    cin >> board_size;
    if(board_size < 0 || board_size > max_board)
        cout <<"The number must be between 0 and " << max_board<<endl;
    else {
        Queens configuration(board_size);
        start_time = clock();
        solve_from(configuration);
        end_time = clock();
    }
    cout << "The statistics for " << board_size << " Queens problem:"<<endl;
    cout << "The number of solutions: " << sol_num << endl;
    cout << "The time used:" << static_cast<double>(end_time-start_time)/CLOCKS_PER_SEC << "s"<<endl;
}

/* * To recursively sole the n-Queens problem, to change the first line * can give the statistics of the n-Queens problem. That is, then number * of solutions for a specific n-Queens problems. */
void solve_from(Queens &configuration){
    //if(configuration.is_solved()) configuration.print();
    if(configuration.is_solved()) sol_num++;
    else{
        for(int col=0; col < configuration.board_size; col++)
            if(configuration.unguarded(col)){
                configuration.insert(col);
                solve_from(configuration);// Recursively continue to add queens
                configuration.remove(col);
            }
    }
}
2.2 我的电脑环境
电脑购买与2011年12份,内存2 GB,CUP 为AMD Phenom (tm) II N930 Quad-Core Processor 2 GB,操作系统为Windows 7 Professional,在其上安装Cygwin软件,其中的gcc 4.9.3版本。
3 运行结果对比
书中的具体计算机的配置和型号不知,我们将其代表为1999年的计算机,而我的计算机则为2011年,虽然我在2015年运行的该程序。二者产生的数据基于同样的源代码。
表1 1999年计算机运行结果
| Size | Num_sol | Time(seconds) |
|---|---|---|
| 8 | 92 | 0.05 |
| 9 | 352 | 0.21 |
| 10 | 724 | 1.17 |
| 11 | 2680 | 6.62 |
| 12 | 14200 | 39.11 |
| 13 | 73712 | 243.05 |
表2 2011年计算机运行结果
| Size | Num_sol | Time(seconds) |
|---|---|---|
| 8 | 92 | 0.016 |
| 9 | 352 | 0.015 |
| 10 | 724 | 0.062 |
| 11 | 2680 | 0.218 |
| 12 | 14200 | 1.17 |
| 13 | 73712 | 7.145 |
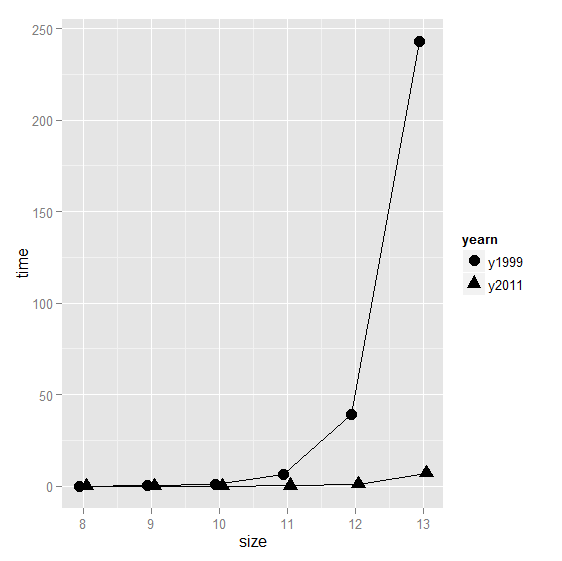
上面的数据最好画成图的形式,观看更为方便:

【备注】:画上图采用的R代码如下:
 >library(ggplot2)
 >yearn <-  c('y1999','y1999','y1999','y1999','y1999','y1999','y2011','y2011','y2011','y2011','y2011','y2011')
 > size <-c(8,9,10,11,12,13,8,9,10,11,12,13)
 > time <-c(0.05,0.21,1.17,6.62,39.11,243.05,0.016,0.015,0.062,0.218,1.17,7.145)
 > queenData <- data.frame(year,size,time)
 > ggplot(queenData,aes(x=size,y=time,shape=yearn))+geom_line(position=position_dodge(0.2))+geom_point(position=position_dodge(0.2),size=4)
从上图可以看出,当size为8,9,10时二者的运行时间差别不大,但当size为更大的数值时,2011y的运行时间明显少的多,说明当前计算机硬件的发展促进了计算机速度的明显提升。这是一个令人兴奋的结果。