R语言:多幅图形组合为一幅图形的方法
备注:学习备忘
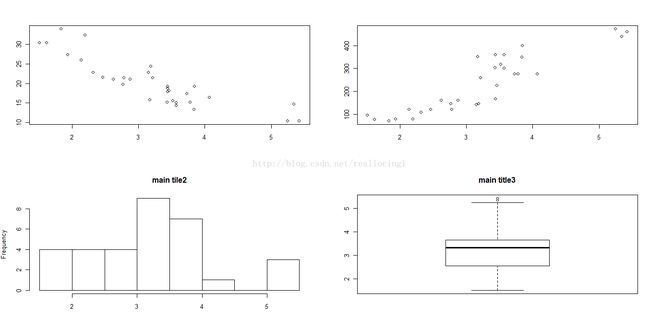
在R中使用函数par()或layout()可以容易地组合多幅图形为一幅总括图形。
你可以在par()函数中使用图形参数mfrow=c(nrows, ncols)来创建按行填充的、行数为
nrows、列数为ncols的图形矩阵。另外,可以使用nfcol=c(nrows, ncols)按列填充矩阵。
> attach(mtcars)
> opar<-par(no.readonly=T)
> par(mfrow=c(2,2))
> plot(wt,mpg,main="Main Title")
> plot(wt,disp,main="Main Tile1")
> hist(wt,main="main tile2")
> boxplot(wt,main="main title3")
> par(opar)
> detach(mtcars)

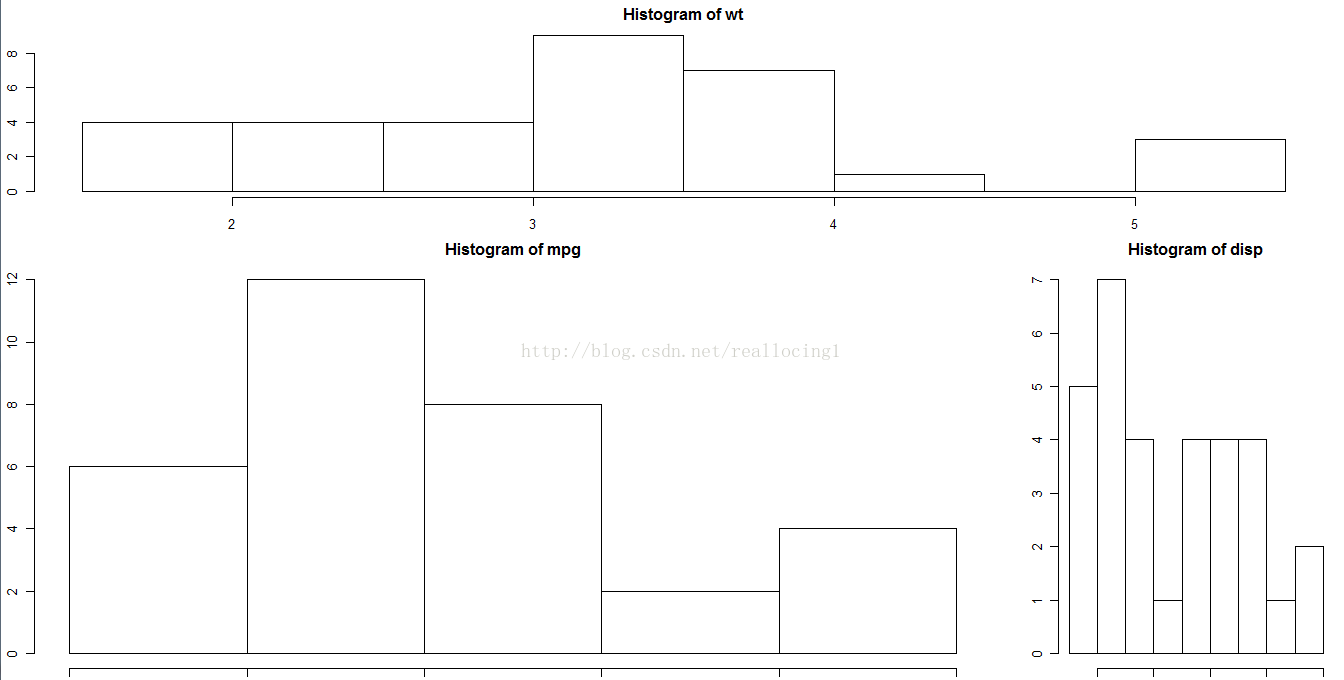
函数layout()的调用形式为layout(mat),其中的mat是一个矩阵,它指定了所要组合的
多个图形的所在位置。在以下代码中,一幅图被置于第1行,另两幅图则被置于第2行:
attach(mtcars)
layout(matrix(c(1,1,2,3),2,2,byrow=T))
hist(wt)
hist(mpg)
hist(disp)
detach(mtcars)
精确地控制每幅图形的大小,可以有选择地在layout()函数中使用widths=和
heights=两个参数。其形式为:
widths = 各列宽度值组成的一个向量
heights = 各行高度值组成的一个向量
相对宽度可以直接通过数值指定,绝对宽度(以厘米为单位)可以通过函数lcm()来指定。
detach(mtcars)
> attach(mtcars)
> layout(matrix(c(1,1,2,3)2,2,byrow=T),widths=c(3,1),heights=c(1,2))
错误: 意外的数值量在"layout(matrix(c(1,1,2,3)2"里
> layout(matrix(c(1,1,2,3),2,2,byrow=T),widths=c(3,1),heights=c(1,2))
> hist(wt)
错误于plot.new() : 图版边太大
> par(mfrow=c(1,1))
> layout(matrix(c(1,1,2,3),2,2,byrow=T),widths=c(3,1),heights=c(1,2))
> hist(wt)
错误于plot.new() : 图版边太大
> layout(matrix(c(1,1,2,3),2,2,byrow=T),widths=c(3,1),heights=c(1,2))
> hist(wt)
错误于plot.new() : 图版边太大
> par(mar=c(5,4,4,2)+0.1)
> layout(matrix(c(1,1,2,3),2,2,byrow=T),widths=c(3,1),heights=c(1,2))
> hist(wt)
错误于plot.new() : 图版边太大
> hist(wt)
错误于plot.new() : 图版边太大
> par(mar=c(5,4,4,2)+0.1)
> hist(wt)
错误于plot.new() : 图版边太大
> par(mar=c(2,2,2,2)+0.1)
> hist(wt)
> hist(mpg)
> hist(disp)
> detach()
