时间序列识别与预测语句
今天看了一篇关于金融时间序列的文章《Financial Analysis Using SAS ® PROCS》,文章简明扼要地介绍了三个常用语句,其中包括proc timeseries,很好地解释了之前的的遗憾。现摘录翻译文章的部分内容:
1.时间序列的数据,数据来源于Yahoo Finace web的TXN股票数据,收集下面5组数据得到TXN数据。
June 15, 1987: 3 to 1 split (stockholders received 3 shares for 1)
August 21, 1995: 2 to 1 split (stockholders received 2 shares for 1)
November 24, 1997: 2 to 1 split (stockholders received 2 shares for 1)
August 17, 1999: 2 to 1 split (stockholders received 2 shares for 1)
May 23, 2000: 2 to 1 split (stockholders received 2 shares for 1
2.PROC TIMESERIES语句
该语句可以计算各种统计量来分析季节性、时间趋势或可以转化为时间序列的数据。利用该语句可以得到:描述性的统计量,季节分解分析,相关分析,交互关系的分析等等。文章利用proc timeseries语句来识别该数据是怎么样的时间序列:
ods graphics on;
proc timeseries data=txi out=monthtxi plot=(series corr decomp);
Id date interval=month accumulate=median;
var close;
run;
ods graphics off;
上图是PROC TIMESERIES对真实数据处理的结果
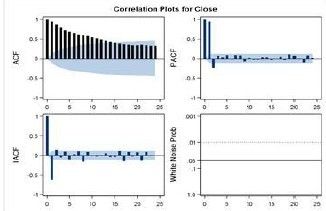
下图是该语句相关性检验的结果:
3.proc forecast语句
该语句可以做预测,得到输出结果的置信区间
proc forecast data=monthtxi interval=month
method=expo trend=2 lead=6
out=out outfull outest=est;
id date;
var close;
run;
要想得到forecast结果图形,需要利用PROC GPLOT语句作图
symbol1 i=none c=black v=X f='Arial'
symbol2 i=spline c=red v=dot cv=blue ;
symbol3 i=spline c=blue l=3 v =L w=2 f='Arial' ; /* for _type_=L95 */
symbol4 i=spline l=3 c=orange v=U w=2 f='Arial'; /* for _type_=U95 */
proc gplot data=out;
plot close * date = _type_ / VAXIS=axis1 haxis=axis2 FRAME vminor=0
hminor=0 cframe = white skipmiss;
axis1 label=( a=90 r=0 "close $")
value=() width=2 ;
axis2 label=( "year")
value=() width=2
offset=(4 pct);
run;
quit;
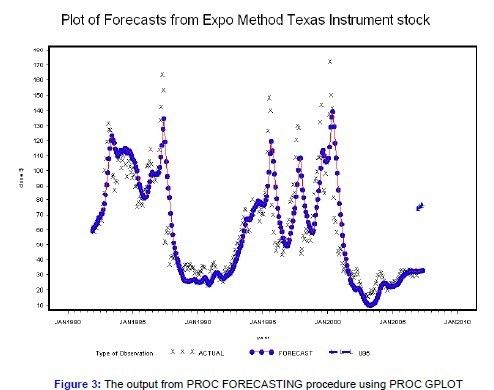
下面图形就是在一定置信度条件的预测结果:


