HighChart前后台封装,构造个性化图表插件highChartTools,快捷创建各种图表
$(function () {
    $('#container').highcharts({
        title: {
            text: 'Monthly Average Temperature',
            x: -20 //center
        },
        subtitle: {
            text: 'Source: WorldClimate.com',
            x: -20
        },
        xAxis: {
            categories: ['Jan', 'Feb', 'Mar', 'Apr', 'May', 'Jun','Jul', 'Aug', 'Sep', 'Oct', 'Nov', 'Dec']
        },
        yAxis: {
            title: {
                text: 'Temperature (°C)'
            },
            plotLines: [{
                value: 0,
                width: 1,
                color: '#808080'
            }]
        },
        tooltip: {
            valueSuffix: '°C'
        },
        legend: {
            layout: 'vertical',
            align: 'right',
            verticalAlign: 'middle',
            borderWidth: 0
        },
        series: [{
            name: 'Tokyo',
            data: [7.0, 6.9, 9.5, 14.5, 18.2, 21.5, 25.2, 26.5, 23.3, 18.3, 13.9, 9.6]
        }, {
            name: 'New York',
            data: [-0.2, 0.8, 5.7, 11.3, 17.0, 22.0, 24.8, 24.1, 20.1, 14.1, 8.6, 2.5]
        }, {
            name: 'Berlin',
            data: [-0.9, 0.6, 3.5, 8.4, 13.5, 17.0, 18.6, 17.9, 14.3, 9.0, 3.9, 1.0]
        }, {
            name: 'London',
            data: [3.9, 4.2, 5.7, 8.5, 11.9, 15.2, 17.0, 16.6, 14.2, 10.3, 6.6, 4.8]
        }]
    });
});
前台封装:
每次书写类似代码,比较繁琐而且不易维护,当图表比较多时,维护困难,因此有必要再次封装,提取公共部分进行封装重构。通过官网API,可以发现图表都具有的公共属性:标题(title、subTitle)、X轴(xAxis)、Y轴(yAxis)、图例(legend)、数据点选项(plotOptions)、数据项(series),所以我们只需要对这些个元素进行处理即可。
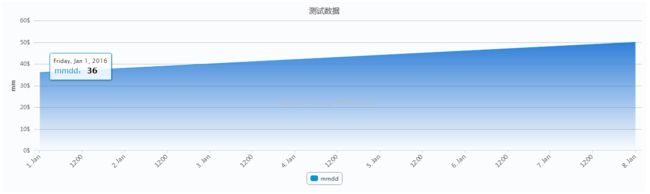
前台封装后使用如下方式构建图表:
function testMultiColumn(){
    $.getJSON("../chart/HighChart!queryMutliColumn2.action",{},
        function (data) {
            var highChart = new $.highChart({
                renderTo: "chartDiv",
                chartType: "combine",
                chart:{chartBgColor:"#FBFCFD"},
                title: "测试数据",
                xCategories:data.categories,
                xCategoriesKey:data.categoriesKey,
                yAxisSetting: [{ key: "cityData",name:"交易额",unit:"$" ,oppositeOption: false},
                    { key: "month",name:"mm",unit:"$" ,oppositeOption: true}],
                yAxisColumn: [{ key: "cityData",name:"D5000数据",unit:"$",chartType:"column"},
                    { key: "cityData",name:"数据中心",chartType:"line"},
                    { key: "month",name:"mmdd",chartType:"spline",yIndex:1}],
                series: data.series,
                legend:{"enabled":true},
                plotOptions:{"dataEnable":true},
                combPieChart:{name:"name"},
                enabledCombinationChart:true,
                click: function (params) {
                    queryColumnDetail(params);
                }
            });
            highChart.create();
        }
    );
}
renderTo为展示的DIV ID,chart为图表的设置、chartType图表的展示类型、title主标题、subtitle副标题、xAxisName X轴名称、xCategoriesX轴数据、yAxisSetting Y轴设置、series数据项。
highChart配置如下:
    	  var options = $.extend({
    		  //背景颜色
    		  chart:{chartBgColor:'#FFFFFF',width:"",height:""},
              //需要展示的位置(哪个DOM元素内)
              renderTo: $(document.body),
              //图表类型:bar,line,spline,column,pie,area,areaspline,combine,bubble,scatter
              chartType: "",
              zoomType:"",//放大轴
              //图表大标题
              title: "",
              //图表小标题
              subtitle: "",
              //X轴名称
              xAxisName: "",
              //X轴列表数据,是一个JSON的LIST对象
              xCategories:{},
              xCategoriesKey:{},
              //Y轴设置,可添加多条Y轴, key-Y轴名称,oppositeOption-true/false(true为right, false为left),unit:单位
              yAxisSetting: [{ key: "",name:"" ,unit:"",oppositeOption: false}],
              //key-Y轴对应数据,nane-名称,chartType-图形类型,yIndex-每个指标集需要对应的具体Y轴索引
              yAxisColumn: [{ key: "",name:"",unit:"",chartType: "", yIndex: 0, color: null}],
              //图表数据源,是一个JSON的LIST对象
              series: {},
              unit:"",//单位
              //Point MouseOver事件
              mouseOver: function () { },
              //Point mouseOut事件
              mouseOut: function () { },
              //Point click事件:出发下钻方法
              click: function () { },
              //是否开启导出按钮
              exportButton: true,
              //图标容器大小
              containerSize:{width:null,height:null},
              //图例选项:默认不显示:具体的配置请参看API
              legend:{enabled:false,layout:"",align:"",verticalAlign:"",floating:false,x:"",y:"",backgroundColor:"#FFFFFF"},
              //数据点选项
              //showInLegend:是否显示饼图图例,dataEnable:是否显示饼图数据点
              plotOptions:{showInLegend:false,dataEnable:false},
              //基本参数设置:主要用于设置图表高度、宽度
              chart:{width:"",height:""},
                  //是否显示复合图中的饼图,默认不显示
              enabledCombinationChart:false,
              combPieChart:{//复合图
                  name: "",
                  type: "pie",
                  data:[],
                  center: [30, 20],
                  size: 100,
                  showInLegend: false,
                  dataLabels: {
                      enabled: false
                  },
                  events:{
                      enabled:false
                  }
              }

          }, setting);
完整highChartTools.js
/**
* highChart增强插件
* author:lxf
* date:2016-06-13
* @param $
*/
(function ($) {
jQuery.extend({
highChart:function (setting) {
var options = $.extend({
//背景颜色
chart:{chartBgColor:'#FFFFFF',width:"",height:""},
//需要展示的位置(哪个DOM元素内)
renderTo: $(document.body),
//图表类型:bar,line,spline,column,pie,area,areaspline,combine,bubble,scatter
chartType: "",
zoomType:"",//放大轴
//图表大标题
title: "",
//图表小标题
subtitle: "",
//X轴名称
xAxisName: "",
//X轴列表数据,是一个JSON的LIST对象
xCategories:{},
xCategoriesKey:{},
//Y轴设置,可添加多条Y轴, key-Y轴名称,oppositeOption-true/false(true为right, false为left),unit:单位
yAxisSetting: [{ key: "",name:"" ,unit:"",oppositeOption: false}],
//key-Y轴对应数据,nane-名称,chartType-图形类型,yIndex-每个指标集需要对应的具体Y轴索引
yAxisColumn: [{ key: "",name:"",unit:"",chartType: "", yIndex: 0, color: null}],
//图表数据源,是一个JSON的LIST对象
series: {},
unit:"",//单位
//Point MouseOver事件
mouseOver: function () { },
//Point mouseOut事件
mouseOut: function () { },
//Point click事件:出发下钻方法
click: function () { },
//是否开启导出按钮
exportButton: true,
//图标容器大小
containerSize:{width:null,height:null},
//图例选项:默认不显示:具体的配置请参看API
legend:{enabled:false,layout:"",align:"",verticalAlign:"",floating:false,x:"",y:"",backgroundColor:"#FFFFFF"},
//数据点选项
//showInLegend:是否显示饼图图例,dataEnable:是否显示饼图数据点
plotOptions:{showInLegend:false,dataEnable:false},
//基本参数设置:主要用于设置图表高度、宽度
chart:{width:"",height:""},
//是否显示复合图中的饼图,默认不显示
enabledCombinationChart:false,
combPieChart:{//复合图
name: "",
type: "pie",
data:[],
center: [30, 20],
size: 100,
showInLegend: false,
dataLabels: {
enabled: false
},
events:{
enabled:false
}
}
}, setting);
//基本参数设定
options.renderTo = (typeof options.renderTo == "string" ? $(options.renderTo) : options.renderTo);
var _renderTo = options.renderTo; //显示容器
var _unit = options.unit; //显示容器
var _chartType = options.chartType.toString().toLowerCase(); //图表类型
var _title = options.title.toString(); //主标题
var _subtitle = options.subtitle.toString(); //副标题
var _xAxisName = options.xAxisName.toString(); //x轴标题
var _yAxisSettingSource = options.yAxisSetting; //y轴
var _yAxisColumnSource = options.yAxisColumn;
var _xCategories = options.xCategories;
var _xCategoriesKey = options.xCategoriesKey;
var _series = options.series; //数据
var _exportBtn = options.exportButton; //是否打印
var _legend = options.legend; //图例选项
var _plotOptions = options.plotOptions; //数据点选项
var _xAxisCategoryVal = []; //x轴列表数据
var _xAxisCategoryKeyVal = []; //x轴列表数据
var _xAxisSettingArr = {}; //x轴选项
var _yAxisSettingArr = []; //y轴选项
var _yAxisColumnVal = []; //
var _chartObj = {}; //图表控件对象
var _toolTipArr = {}; //数据点提示框
var _width = options.chart.width == "" ? options.containerSize.width:options.chart.width;
var _height = options.chart.height == "" ? options.containerSize.height:options.chart.height;
var _rotation = -45; //X轴倾斜度
var _chartBgColor = options.chart.chartBgColor; //图表背景颜色
//事件控制
var _mouseOverEvent = options.mouseOver;
var _mouseOutEvent = options.mouseOut;
var _clickEvent = options.click;
var _zoomType = options.zoomType =="" ? "x" :options.zoomType;
var _chartTemp = {
renderTo: _renderTo.selector,
width:_width,
height:_height,
backgroundColor:_chartBgColor
};
var _combinationChartPie = { name: "",
type: "pie",
data:[],
center: [40, 20],
size: 100,
showInLegend: false,
allowPointSelect: false,
dataLabels: {
enabled: false
},
events:{
enabled:false
}};
_combinationChartPie.name = options.combPieChart.name;
var _enabledCombinationChart = options.enabledCombinationChart;
//基本样式(Y轴,X轴样式)
var _style = {fontSize: '12px',fontFamily: 'Microsoft YaHei,arial',color:'#606060'};
/**
* 设置图表参数
* 设置X轴(维度),Y轴指标列(根据不同图形类型转化成不同X轴,Y轴数据源)
*/
var getChartSetting = function () {
//数据点提示框
_toolTipArr = _chartType == "pie" ?{
useHTML: false,
formatter: function() {
var s = "" + this.key + ": <b>" + Highcharts.numberFormat(this.y, 0) + _unit+"</b><br/>百分比:<b>" + this.percentage.toFixed(2) + "%</b>";
return s;
}
} :
{
headerFormat: '<span style="font-size:10px">{point.key}</span><table>',
pointFormat: '<tr><td style="color:{series.color};padding:0">{series.name}:</td>' +
'<td style="padding:0"><b>{point.y}</b></td></tr>',
footerFormat: '</table>',
shared: true,
useHTML: true
};
var _xAxisCategoryArr = [];
var _xAxisCategoryKeyArr = [];
var _yAxisSettings = [];
var _yAxisColumnArr = [];
//设置X轴数据
$(_xCategories).each(function (index, item) {
_xAxisCategoryArr.push(item.toString());
});
//设置keyValue轴数据
$(_xCategoriesKey).each(function (index, item) {
_xAxisCategoryKeyArr.push(item.toString());
});
_xAxisCategoryVal = _xAxisCategoryArr;
_xAxisCategoryKeyVal = _xAxisCategoryKeyArr;
//设置Y轴相关信息:Y轴可能存在多条,如果存在多条需要设定opposite
/**
* [
* {
* key: "dailyStatistics",
* name:"交易额",
* oppositeOption: false
* },
* {
* key: "daily",
* name:"交易额2",
* oppositeOption: true
* }
* ]
*
*
* needDatas:
*
* yAxis: [{ // Primary yAxis
labels: {
format: '{value}°C',
style: {
color: '#89A54E'
}
},
title: {
text: 'Temperature',
style: {
color: '#89A54E'
}
}
}, { // Secondary yAxis
title: {
text: 'Rainfall',
style: {
color: '#4572A7'
}
},
labels: {
format: '{value} mm',
style: {
color: '#4572A7'
}
},
opposite: true
}]
*/
$(_yAxisSettingSource).each(function (index, item) {
var _tempObj;
if (_yAxisSettingSource.length > 1) {
_tempObj = { title: { text: item.name}, opposite: item.oppositeOption,min:0};
} else {
_tempObj = { title: { text: item.name},min:0};
}
_tempObj.title.style=_style;
_tempObj.labels ={style: _style,format:'{value}'+item.unit};
_yAxisSettings.push(_tempObj);
});
_yAxisSettingArr = _yAxisSettings;
_xAxisSettingArr = _getXAxisSettingArr();
//设置Y轴数据
/**
* 数据格式:
* [{
"name": "M1",
"data":[11,31]
},
{
"name": "M2",
"data":[11,22]
}];
*/
var _tempObj;
var pieData=[];
$(_yAxisColumnSource).each(function (index, item) {
if (_chartType == "pie") { //饼图需要指定类型,且显示数据格式不同
if (index < 1) { //饼图只有一个维度
_tempObj = { name: item.name, data: [], type: "pie", allowPointSelect: false, showInLegend: true };
var pieModel = {};
$(_series).each(function (idx, dataItem) {
//构建显示数据
pieItemName = dataItem.key.toString(); //显示key
var _datas = dataItem.data;
$(_datas).each(function(i,value){ //饼图只有维度,只需迭代一次
var _y = value.y[0];
var _name = value.categoryKey;
var _drilldown = value.drilldown;
var _params = value.params;
if(_drilldown){ //存在下钻
pieModel = {name:_name,y:_y,params:_params,drilldown:_drilldown};
}
else{
pieModel = {name:_name,y:_y};
}
// if(i == 1 || i == "1"){是否选中
// pieModel.sliced = true;
// pieModel.selected = true;
// }
_tempObj.data.push(pieModel);
});
});
_yAxisColumnArr.push(_tempObj);
}
} else {
if (_chartType == "combine" && _yAxisSettingSource.length > 1) { //复合图,如果存在多条Y轴,则需要设置Y轴的type
_tempObj = { name: item.name, data: [], type: item.chartType,
yAxis: item.yIndex == undefined ? 0 : item.yIndex, color: item.color};
} else if(_chartType == "datetime"){//实时数据
_tempObj = { name: item.name, data: [],
type: item.chartType,
color: item.color,
pointInterval: item.pointInterval,
pointStart: item.pointStart
};
}else {
_tempObj = { name: item.name, data: [],
type: _chartType == "stack" ? "column" : item.chartType,
color: item.color};
}
_tempObj.tooltip = {valueSuffix: item.unit == undefined ? '' : item.unit};
/**
* 原始数据:
* "series": [{
"data": [{
"categoryKey": "M1",
"drilldown": false,
"params": null,
"upOrDown": "",
"y": ["11","12"]
},
{
"categoryKey": "M2",
"drilldown": false,
"params": null,
"upOrDown": "",
"y": ["21","22"]
}],
"key": "dailyStatistics"
}]
*/
$(_series).each(function (idx, dataItem) {
//构建显示数据
var _key = dataItem.key;
var _datas = dataItem.data;
if(_key == item.key){//是否为同一类型
$(_datas).each(function(i,value){//需修改
if(item.name == value.categoryKey){
var pieDataObj = {};
var _value = {};
var _y = value.y;
var _drilldown = value.drilldown;
var _params = value.params;
if(_drilldown){ //存在下钻
_value = {y:_y,params:_params,drilldown:_drilldown};
}
else{
_value = _y;
}
_tempObj.data = _value ;
pieDataObj.name=item.name;
var pDataObjY = 0;
$(value.y).each(function (pid, pDataItem) {
pDataObjY += pDataItem;
});
pieDataObj.y = pDataObjY;
pieData.push(pieDataObj);
}
});
}
});
_yAxisColumnArr.push(_tempObj);
}
});
// _yAxisColumnArr = [{
// "name": "M1",
// "data": [11,12]
// },
// {
// "name": "M2",
// "data": [21,22],
// "type": "line"
// }];
_combinationChartPie.data = pieData;
if (_enabledCombinationChart) //是否显示复合图中的饼图,默认为否,不显示
_yAxisColumnArr.push(_combinationChartPie);
_yAxisColumnVal = _yAxisColumnArr;
};
//获取数据图表相应设置,x轴
var _getXAxisSettingArr = function () {
var temp = {
title: { text: _xAxisName ,style: _style},
labels: {
rotation: _rotation, //文字倾斜度,防止X轴过多而导致文字显示乱
align: 'right',
style: _style
}
};
if(_chartType== undefined || _chartType == "datetime"){
temp.type='datetime';
}else {
temp.categories=_xAxisCategoryVal;
}
return temp;
};
//zoomType: 'x'沿着X轴放大,依次类推zoomType: 'x'沿着X轴放大,依次类推
var _getChartSetting = function () {
if(_chartType != "datatime"){
_chartTemp.type=_chartType;
}
if(_zoomType != "")
_chartTemp.zoomType=_zoomType;
}
/**
* 画图
*/
var draw = function () {
//画图之前转化相应的XY信息
_getChartSetting();
getChartSetting();
var chart = new Highcharts.Chart({
chart: _chartTemp,
colors:['#0099CC', '#FF9900', '#99CC33', '#FF6666', '#993366', '#009933', '#FF9655',
'#FFF263', '#6AF9C4'],
title: {
text: _title,
style:{color:'#333333',fontSize:'16px',fontFamily:'Microsoft YaHei,arial'}
},
subtitle: {
text: _subtitle,
style:{color:'#555555',fontFamily:'Microsoft YaHei,arial'}
},
tooltip: _toolTipArr,
xAxis: _xAxisSettingArr,
yAxis: _yAxisSettingArr,
legend: _legend,
exporting: {
enabled:_exportBtn
},
credits:{
enabled:false
},
plotOptions: {
area: {
fillColor: {
linearGradient: { x1: 0, y1: 0, x2: 0, y2: 1},
stops: [
[0, Highcharts.getOptions().colors[0]],
[1, Highcharts.Color(Highcharts.getOptions().colors[0]).setOpacity(0).get('rgba')]
]
},
lineWidth: 1,
marker: {
enabled: false
},
shadow: false,
states: {
hover: {
lineWidth: 1
}
},
threshold: null
},
pie: {
allowPointSelect:false,//允许选项是否选中,选中时不再凸出
cursor: 'pointer',
dataLabels: {
enabled: _plotOptions.dataEnable,
color: '#000000',
connectorColor: '#000000',
format: '<b>{point.name}</b>: {point.percentage:.2f} %'
},
showInLegend: _plotOptions.showInLegend
},
column: {
stacking: _chartType == "stack" ? "normal" : ""
},
scatter: {
marker: {
radius: 5,
symbol: "circle"
}
},
series: {
allowPointSelect: true ,
states: {
hover: {
enabled: true, //显示阴影
halo:{
size:0 //阴影带宽度为0px
}
}
},
point: {//点触发时间
events: {
mouseOver: function () {
_mouseOverEvent();
},
mouseOut: function () {
_mouseOutEvent();
},
click: function () {
//根据是否进入钻取的状态重绘不同的图表
var drilldown = this.options.drilldown;
if(drilldown){ //下钻
_clickEvent(this.options.params);
}
var data;
if(_chartType == "pie")
data = {"seriesName":this.name};
else
data = {"category":this.category,"value":this.y,"seriesName":this.series.name};
if(_xAxisCategoryKeyVal.length > 0){
data.categoryKey=_xAxisCategoryKeyVal[this.x];
}
if(this.series.type == "pie"){
data = {"seriesName":this.name};
}
_clickEvent(data);
}
}
}
}
},
series:_yAxisColumnVal
});
_chartObj = chart;
};
//获取图表控件基本设置属性
this.getChartOptions = function () {
return options;
};
//设置图标控件基本属性
this.setChartOptions = function (settings) {
options.title = settings.title;
options.subtitle = settings.subtitle;
options.xAxisName = settings.xAxisName;
options.yAxisSetting = settings.yAxisSetting;
options.yAxisColumn = settings.yAxisColumn;
};
//获取图表控件对象
this.getChartObject = function () {
return _chartObj;
};
//刷新图表控件
this.refresh = function () {
draw();
};
//控件初始化事件
this.create = function () {
draw();
};
return this;
}
});
})(jQuery);
后台封装:
后台从数据库中查询出的数据一般都是List<Map<String,Object>>格式的,为了满足前台所需数据结构,需要对数据进行处理。使用模板模式设计模式,类图如下: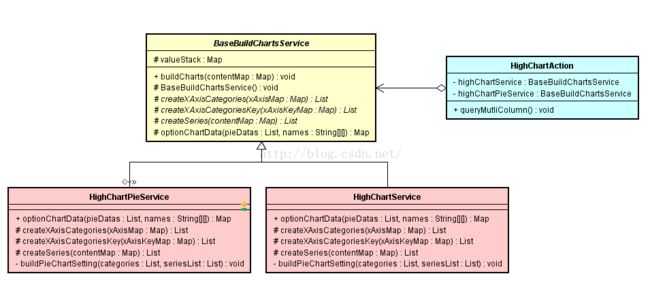
BaseBuildChartsService中方法
protected abstract List<String> createXAxisCategories(Map<String,Object> xAxisMap);//x轴显示数据
protected abstract List<String> createXAxisCategoriesKey(Map<String,Object> xAxisKeyMap);//x轴显示数据对应的编码
//数据
protected abstract List<SeriesChartVO> createSeries(Map<String,Object> contentMap) throws Exception;
protected abstract Map<String, Object> optionChartData(List<Map<String,Object>> pieDatas, String[][] names)throws Exception;//数据库查询结果处理
因为饼图(pie)和其他类型的图,数据格式不同,所以创建了不同的类处理数据,返回处理后的Json格式的valueStack到前台,前台调用封装后的方法就可以构建图表。
作为工具类的图表服务如下:
HighChartPieService:
package com.lxf.base.service;

import com.lxf.base.bean.chart.SeriesChartVO;
import com.lxf.base.bean.chart.SeriesDatasVO;
import net.sf.json.JSON;
import net.sf.json.JSONObject;
import org.springframework.stereotype.Service;

import java.util.ArrayList;
import java.util.HashMap;
import java.util.List;
import java.util.Map;

/**
 * Created by dell on 2016/6/13.
 */
@Service
public class HighChartPieService extends BaseBuildChartsService {
    @Override
    protected List<String> createXAxisCategories(Map<String, Object> xAxisMap) {
        List<String> categories = (List<String>) xAxisMap.get("list");
        return categories;
    }

    @Override
    protected List<String> createXAxisCategoriesKey(Map<String, Object> xAxisKeyMap) {
        List<String> categoriesKey = (List<String>) xAxisKeyMap.get("keyList");
        return categoriesKey;
    }

    @Override
    protected List<SeriesChartVO> createSeries(Map<String, Object> contentMap) throws Exception {
        List<JSON> jsons = (List<JSON>) contentMap.get("seriesList");
        List<SeriesDatasVO> dataList = new ArrayList<SeriesDatasVO>();
        SeriesDatasVO datas = null;
        String name = "";
        for(int i = 0 ; i < jsons.size() ; i++){
            JSONObject json = JSONObject.fromObject(jsons.get(i));
            name = (String) json.get("name");
            Object y = json.get("data");
            datas = new SeriesDatasVO(name, y);
//            datas = new SeriesDatasVO(name, y,true,json,null);
            dataList.add(datas);
        }
        SeriesChartVO chartVO = new SeriesChartVO("pieData", dataList);
        List<SeriesChartVO> chartList = new ArrayList<SeriesChartVO>();
        chartList.add(chartVO);
        return chartList;
    }

    /**
     * 饼图数据
     * @return
     */
    private List<Map<String,Object>> buildPieDatas(){
        List<Map<String,Object>> rs = new ArrayList<Map<String, Object>>();
        for (int i = 10; i < 18; i++) {
            String orgNo = "414"+i;
            String orgName = "city"+i;
            int num = 20+i;
            Map<String,Object> map = new HashMap<String,Object>();
            map.put("orgNo",orgNo);
            map.put("orgName",orgName);
            map.put("num",num);
            rs.add(map);
        }
        return rs;
    }


    /**
     * 多项饼图
     * @param pieDatas
     * @param namesPZ [orgno,num]
     * @return
     * @throws Exception
     */
    public Map<String, Object> optionChartData(List<Map<String,Object>> pieDatas, String[][] namesPZ) throws Exception {
        pieDatas = buildPieDatas();
        List<JSON> data = new ArrayList<JSON>();
        String[] names = namesPZ[0];
        String catagoriesKey = names[0];
        List<String> categoriesKeyValue = new ArrayList<String>();
        for (Map<String, Object> pieData : pieDatas) {
            String keyName = names[1];//地市,各类型对应的Key
            String valName = names[2];//数据,值对应的key
            //第一个Y轴数据
            HashMap hashMap = new HashMap();
            //第一条曲线
            ArrayList pieDataObj = new ArrayList();
            pieDataObj.add(pieData.get(valName));
            hashMap.put("name",pieData.get(keyName));
            hashMap.put("data",pieDataObj);
            categoriesKeyValue.add(pieData.get(catagoriesKey).toString());
            JSONObject jsonObject = JSONObject.fromObject(hashMap);
            data.add(jsonObject);
        }
        return buildPieChartSetting(categoriesKeyValue,data);

    }

    /**
     *
     * @param categories
     * @param seriesList
     * @return
     * @throws Exception
     */
    private Map<String, Object> buildPieChartSetting(List<String> categories,
                                                     List<JSON> seriesList) throws Exception{
        Map<String, Object> categoriesMap = new HashMap<String, Object>();
        Map<String, Object> seriesMap = new HashMap<String, Object>();
        Map<String, Object> contentMap = new HashMap<String, Object>();

        categoriesMap.put("list", categories);
        categoriesMap.put("keyList", categories);
        seriesMap.put("seriesList", seriesList);

        //X轴数据项
        contentMap.put("categories", categoriesMap);
        //数据项
        contentMap.put("series", seriesMap);

        Map map = buildCharts(contentMap);
        return map;
    }

}
HighChartService:
package com.lxf.base.service;

import com.lxf.base.bean.chart.SeriesChartVO;
import com.lxf.base.bean.chart.SeriesDatasVO;
import net.sf.json.JSON;
import net.sf.json.JSONObject;
import org.springframework.stereotype.Service;

import java.util.ArrayList;
import java.util.HashMap;
import java.util.List;
import java.util.Map;

/**
 * Created by dell on 2016/6/13.
 */
@Service
public class HighChartService extends BaseBuildChartsService {
    @Override
    protected List<String> createXAxisCategories(Map<String, Object> xAxisMap) {
        List<String> categories = (List<String>) xAxisMap.get("list");
        return categories;
    }

    @Override
    protected List<String> createXAxisCategoriesKey(Map<String, Object> xAxisKeyMap) {
        List<String> categoriesKey = (List<String>) xAxisKeyMap.get("keyList");
        return categoriesKey;
    }

    @Override
    protected List<SeriesChartVO> createSeries(Map<String, Object> contentMap) throws Exception {
        Map<String,List<JSON>> jsons = (Map<String,List<JSON>>) contentMap.get("seriesList");
        List<SeriesChartVO> chartList = new ArrayList<SeriesChartVO>();
        String name = "";
        for (String seriesKey : jsons.keySet()) {
            List<SeriesDatasVO> dataList = new ArrayList<SeriesDatasVO>();
            for (JSON json : jsons.get(seriesKey)) {
                SeriesDatasVO datas = null;
                JSONObject jsonObject = JSONObject.fromObject(json);
                name = (String) jsonObject.get("name");
                Object y = jsonObject.get("data");
                datas = new SeriesDatasVO(name, y);
//            datas = new SeriesDatasVO(name, y,true,json,null);
                dataList.add(datas);
            }
            SeriesChartVO chartVO = new SeriesChartVO(seriesKey, dataList);
            chartList.add(chartVO);
        }

        return chartList;
    }

/**
     * 创建带x轴数据
     * @param categories
     * @param seriesList
     * @return
     * @throws Exception
     */
    private Map<String, Object> buildChartsSetting(List<String> categories,List<String> categoriesKey,
                                            Map<String,List<JSON>> seriesList) throws Exception{
        Map<String, Object> categoriesMap = new HashMap<String, Object>();
        Map<String, Object> seriesMap = new HashMap<String, Object>();
        Map<String, Object> contentMap = new HashMap<String, Object>();

        categoriesMap.put("list", categories);
        categoriesMap.put("keyList", categoriesKey);
        seriesMap.put("seriesList", seriesList);

        //X轴数据项
        contentMap.put("categories", categoriesMap);
        //数据项
        contentMap.put("series", seriesMap);

        return buildCharts(contentMap);
    }


    public Map<String, Object> optionChartData(List<Map<String,Object>> columnDatas, String[][] names) throws Exception {
        boolean isWriteCategories = false;
        List<String> categories = new ArrayList<String>();
        List<String> categoriesKeyValue = new ArrayList<String>();
        Map<String,List<JSON>> rs = new HashMap<String,List<JSON>>();

        //数据展示信息
        for (String[] name : names) {

            String cateKeyName = name[0];//地市,各类型对应的Key
            String categoriesKey = name[1];//地市,各类型对应的Key
            //name:{"orgNo","day","D5000:D5000数据","dc:数据中心"}
            String yAxisColumnKey = name[2];
            List<JSON> data = new ArrayList<JSON>();
            for (int i = 3; i < name.length; i++) {
                String[] valKeyNames = name[i].split(":");//数据,值对应的key
                //第一个Y轴数据
                HashMap hashMap = new HashMap();
                //第一条曲线
                ArrayList pieDataObj = new ArrayList();
                // 遍历基础数据(结果集)
                for (Map<String, Object> columnData : columnDatas) {
                    if (!isWriteCategories){
                        categories.add(columnData.get(categoriesKey).toString());
                        categoriesKeyValue.add(columnData.get(cateKeyName).toString());
                    }
                    pieDataObj.add(columnData.get(valKeyNames[0])); //dataKeyName:valKeyNames[0]
                }
                isWriteCategories = true;
                hashMap.put("name",valKeyNames[1]);//legendName:valKeyNames[1]
                hashMap.put("data",pieDataObj);
                JSONObject jsonObject = JSONObject.fromObject(hashMap);
                data.add(jsonObject);
            }
            rs.put(yAxisColumnKey,data);
        }
        return buildChartsSetting(categories,categoriesKeyValue,rs);
    }


    /**
     * 多列柱状图
     * @return
     */
    public List<Map<String,Object>> buildMutliColumnDatas(){
        List<Map<String,Object>> rs = new ArrayList<Map<String, Object>>();
        for (int i = 10; i < 18; i++) {
            String orgNo = "414"+i;
            String orgName = "city"+i;
            int num = 20+i;
            Map<String,Object> map = new HashMap<String,Object>();
            map.put("orgNo",orgNo);
            map.put("orgName",orgName);
            map.put("D5000",num);
            map.put("dc",num+i);
            map.put("mm",num+i-4);
            rs.add(map);
        }
        return rs;
    }

}
Action中使用方式:
package com.lxf.repository.action.chart;

import net.sf.json.JSONObject;
import com.lxf.base.service.HighChartPieService;
import com.lxf.base.service.HighChartService;
import org.springframework.beans.factory.annotation.Autowired;
import org.springframework.context.annotation.Scope;
import org.springframework.stereotype.Controller;

import java.util.List;
import java.util.Map;

/**
 * Created by dell on 2016/6/13.
 */
@Controller("/chart/HighChartAction")
@Scope("prototype")
public class HighChartAction extends HighChartActionBean {

    @Autowired
    private HighChartService highChartService;
    @Autowired
    private HighChartPieService highChartPieService;

    /**
     * 基础图
     * @throws Exception
     */
    public void queryMutliColumn2() throws Exception {
        //{结果集中的keyName,结果集中的valueName1:前台图表展示图例名(yAxisColumn中对应的name),结果集中的valueName2:前台图表展示图例名(yAxisColumn中对应的name)}
        List<Map<String,Object>>  columnDatas = highChartService.buildMutliColumnDatas();
//        {"categoriesKey","categoriesName","key","DBColumnName:ChartDataNume"..}
        String[][] names = {{"orgNo","orgNo","cityData","D5000:D5000数据","dc:数据中心"},{"orgNo","orgNo","month","mm:mmdd"}};
        JSONObject jsonObject = JSONObject.fromObject(highChartService.optionChartData(columnDatas, names));
        AjaxPrint(jsonObject.toString());
        System.out.println(jsonObject);
    }


//    _yAxisColumnArr = [{
        //     name: "D5000数据",
        //     data: [11,12,3,11,34,34,34,56,3,56,31,23],
        //     type:"area",
        //     pointInterval:8640000,
        //     pointStart:11260000
        // }];
    public void queryMutli() throws Exception {
        String[][] names = {{"orgNo","orgNo","num"}};
        JSONObject jsonObject = JSONObject.fromObject(highChartPieService.optionChartData(null,names));
        System.out.println(jsonObject.toString());
        AjaxPrint(jsonObject.toString());
    }
}

前台调用:
<%-- Created by IntelliJ IDEA. User: dell Date: 2016/6/15 Time: 8:54 To change this template use File | Settings | File Templates. --%> <%@ page contentType="text/html;charset=UTF-8" language="java" %> <html> <head> <title>MyChartTest</title> <script type="text/javascript" src="../js/jquery.js"></script> <script type="text/javascript" src="../js/highcharts.js"></script> <script type="text/javascript" src="../js/highChartTools.js"></script> <script type="text/javascript" src="../js/json-js/json2.js"></script> <script type="text/javascript"> function queryDetail(params) { $.getJSON("cityName2No.json",function (data) { var params = "郑州"; alert(data[params]); }); } function testMultiPie(){ $.getJSON("../chart/HighChart!queryMutli.action",{}, function (data) { var highChart = new $.highChart({ renderTo: "chartDiv", chartType: "pie", title: "浏览器占比", xAxisName: "", xCategories:data.categories, xCategoriesKey:data.categories, yAxisSetting: "", yAxisColumn: [{ key: "dailyStatistics"}], series: data.series, legend:{"enabled":true}, unit:"num", plotOptions:{"dataEnable":true}, click: function (params) { queryPieDetail(params); } }); highChart.create(); } ); } function testMultiColumn(){ $.getJSON("../chart/HighChart!queryMutliColumn2.action",{}, function (data) { var highChart = new $.highChart({ renderTo: "chartDiv", chartType: "combine", chart:{chartBgColor:"#FBFCFD"}, title: "测试数据", xCategories:data.categories, xCategoriesKey:data.categoriesKey, yAxisSetting: [{ key: "cityData",name:"交易额",unit:"$" ,oppositeOption: false}, { key: "month",name:"mm",unit:"$" ,oppositeOption: true}], yAxisColumn: [{ key: "cityData",name:"D5000数据",unit:"$",chartType:"column"}, { key: "cityData",name:"数据中心",chartType:"line"}, { key: "month",name:"mmdd",chartType:"spline",yIndex:1}], series: data.series, legend:{"enabled":true}, plotOptions:{"dataEnable":true}, combPieChart:{name:"name"}, enabledCombinationChart:true, click: function (params) { queryColumnDetail(params); } }); highChart.create(); } ); } function testMultiColumn2(){ $.getJSON("../chart/HighChart!queryMutliColumn2.action",{}, function (data) { var curDate = new Date(); var jhc = new $.highChart({ renderTo: "chartDiv", chartType: "datetime", zoomType:"x", chart:{chartBgColor:"#FBFCFD"}, title: "测试数据", xCategories:data.categories, xCategoriesKey:data.categoriesKey, yAxisSetting: [ { key: "month",name:"mm",unit:"$" ,oppositeOption: false}], yAxisColumn: [ { key: "month",name:"mmdd",chartType:"area", pointInterval: 24 * 60 * 60 * 1000,//one day // pointStart: Date.UTC(curDate.getFullYear(), curDate.getMonth(), curDate.getDate)}], pointStart: Date.UTC(2016, 0, 01)}], series: data.series, legend:{"enabled":true}, plotOptions:{"dataEnable":true}, click: function (params) { queryColumnDetail(params); } }); jhc.create(); chart = jhc.getChartObject(); } ); } function queryColumnDetail(params){ alert(JSON.stringify(params)); } function queryPieDetail(params){ alert(JSON.stringify(params)); } </script> </head> <body> <input type="button" value="MultiPie" onclick="testMultiPie()"/><br/> <input type="button" value="MultiColumn!" onclick="testMultiColumn()"/><br/> <input type="button" value="datadate!" onclick="testMultiColumn2()"/> <p id = "test"></p> <div id = "chartDiv"></div> </body> </html>显示结果如下

完整项目
完整项目可参考:https://git.oschina.net/SoFeelLove/lxf.utils.git