吴恩达机器学习第三次作业(python实现):多分类与神经网络
多分类
import numpy as np
import matplotlib.pyplot as plt
from scipy.io import loadmat
from scipy.optimize import minimize
from sklearn.metrics import classification_report

"""
每个训练样本是一个20x20的图像
原始数据是一个字典,字典中的X的shape是(5000,400),y的shape是(5000,1)
X的每一行代表一个数字图像的特征向量(400维,一个像素占一维)
y(1,2,3···9,10)代表数字的值(1,2,3···9,0),共有5000个训练样本
"""


# 获取原始数据
def raw_data(path):
    data=loadmat(path)
    return data


# 随机生成一张图片
def random_an_image(x,y):
    index=np.random.randint(0,5000)
    image=x[index]
    fig,ax=plt.subplots(1,1,figsize=(20,20))
    ax.matshow(image.reshape(20,20),cmap='gray_r')
    print("this is",y[index])
    plt.show()


# 随机生成100张图片
def random_100_image(x):
    indexs=np.random.choice(x.shape[0],100)
    images=x[indexs]
    # 将显示幕布分成10行10列,每一份大小是20x20
    fig,axs=plt.subplots(10,10,figsize=(20,20))
    for row in range(10):
        for col in range(10):
            axs[row,col].matshow(images[row*10+col].reshape(20,20),cmap='gray_r')
    plt.show()


def sigmoid(z):
    return 1/(1+np.exp(-z))


# 代价函数
def cost_function(theta,x,y,lam):
    m=x.shape[0]
    first=(y.dot(np.log(sigmoid(x.dot(theta))))+(1-y).dot(np.log(1-sigmoid(x.dot(theta)))))/(-m)
    theta_reg=theta[1:]  # 不惩罚第一项
    second=lam*(theta_reg.dot(theta_reg))/(2*m)
    j=first+second
    return j


# 梯度下降,只需求偏导数即可
def gradient_descent(theta,x,y,lam):
    m=x.shape[0]
    partial_first=((sigmoid(x.dot(theta))-y).T).dot(x)/m
    partial_second=lam*theta/m
    partial_second[0]=0
    partial=partial_first+partial_second
    return partial


# 生成theta矩阵,其中每一行代表一个数字的theta向量(401维),一共10个数字,所以一共10行
def one_to_all(x,y,lam,k):
    theta_all=np.zeros((k,x.shape[1]))
    # print(theta_all.shape)  #(10,401)
    for i in range(1,k+1):
        # 获取每一个数字的y向量
        y_i=np.array([1 if num==i else 0 for num in y])
        # 逐个训练theta向量
        theta_i=theta_all[i-1]
        result=minimize(fun=cost_function,args=(x,y_i,lam),x0=theta_i,method='tnc',jac=gradient_descent)
        # 合并theta向量
        theta_all[i-1]=result.x
    return theta_all


# 获得预测结果矩阵
def predict(theta_all,x):
    h=sigmoid(x.dot(theta_all.T))
    h_max=np.argmax(h,axis=1)  # 获取h每一行的最大值元素下标
    # 因为下标从0开始,所以加1
    h_max=h_max+1
    # print(h_max.shape)  # (5000,)
    return h_max


def main():
    rawdata=raw_data('venv/lib/dataset/ex3data1.mat')
    x1=rawdata['X']
    x=np.c_[np.ones(x1.shape[0]),x1]
    y=rawdata['y'].ravel()  # 降维,方便之后计算
    # print(x.shape,y.shape)  # (5000, 401) (5000,)
    # random_an_image(x1, y)
    random_100_image(x1)
    theta_all=one_to_all(x,y,1,10)
    y_predict=predict(theta_all,x)
    report=classification_report(y_predict,y)
    print(report)


main()
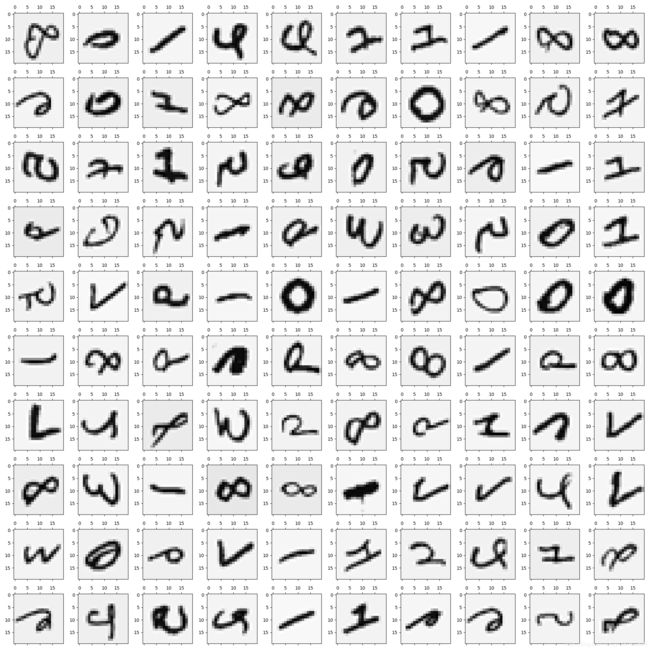
随机100张图片

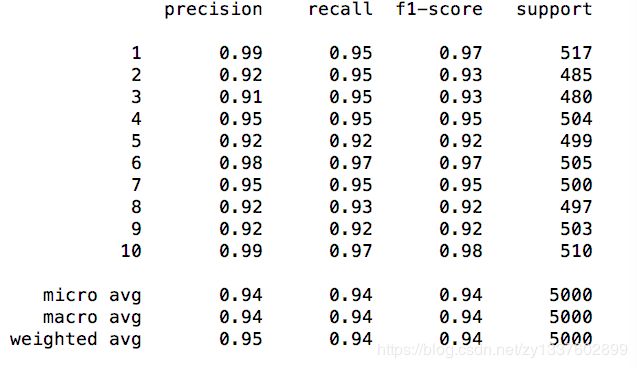
report结果,大概94%多的样子

关于report结果,如果不会看的话,看这里classification_report结果说明
神经网络
这里只做前向传播,权值已经给出
import numpy as np
from scipy.io import loadmat
from sklearn.metrics import classification_report
"""
不需要计算权值,仅做前向传播
"""


def raw_data(path):
    data=loadmat(path)
    return data


def sigmoid(z):
    return 1/(1+np.exp(-z))


def predict(y):
    h_max=np.argmax(y,axis=1)
    h_max=h_max+1
    return h_max


def main():
    rawdata=raw_data('venv/lib/dataset/ex3data1.mat')
    weight=raw_data('venv/lib/dataset/ex3weights.mat')
    x1=rawdata['X']
    x=np.c_[np.ones(x1.shape[0]),x1]
    y=rawdata['y'].ravel()
    theta1=weight['Theta1']
    theta2 = weight['Theta2']
    # print(x.shape,y.shape,theta1.shape,theta2.shape)  # (5000, 401) (5000,) (25, 401) (10, 26)
    a1=x
    z2=a1.dot(theta1.T)
    a2=sigmoid(z2)
    a2=np.c_[np.ones(a2.shape[0]),a2]
    z3=a2.dot(theta2.T)
    a3=sigmoid(z3)
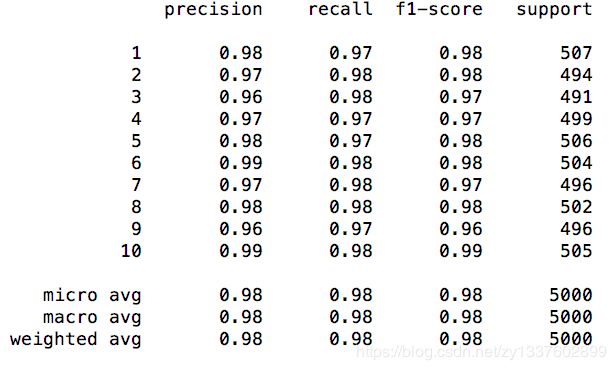
    report=classification_report(predict(a3),y)
    print(report)


main()

