python3线性回归
目录
导包
获得数据
数据清洗
第二种导入方法
清除inf和nan
训练线性回归方程
总体相关参数
交叉检验
不同时期相关性
导包
import pandas as pd
import numpy as np
from urllib.request import urlretrieve
获得数据
>>> vs_url = 'http://WWW.stoxx.com/download/historical_values/h_vstoxx.txt'
>>> es_url = 'http://WWW.stoxx.com/download/historical_values/hbrbcpe.txt'
urlretrieve(es_url ,  './data/es.txt')
('./data/es.txt', )
urlretrieve(vs_url ,  './data/vs.txt')
('./data/vs.txt', )
>>> lines = open('./data/es.txt', 'r').readlines()
>>> lines = [line.replace( ' ',"")for line in lines]
>>> lines[:6]
['PriceIndices-EUROCurrency\n', 'Date;Blue-Chip;Blue-Chip;Broad;Broad;ExUK;ExEuroZone;Blue-Chip;Broad\n', ';Europe;Euro-Zone;Europe;Euro-Zone;;;Nordic;Nordic\n', ';SX5P;SX5E;SXXP;SXXE;SXXF;SXXA;DK5F;DKXF\n', '31.12.1986;775.00;900.82;82.76;98.58;98.06;69.06;645.26;65.56\n', '01.01.1987;775.00;900.82;82.76;98.58;98.06;69.06;645.26;65.56\n']
数据清洗
>>> new_file = open('./data/es50.txt', 'w')
>>> new_file.writelines('date' + lines[3][:-1]+ ';DEL' + lines[3][-1]) #列数据+:DEL+'\n'
>>> new_file.writelines(line[4:])
>>> new_file.close()
>>> es = pd.read_csv ( './data/es50.txt' , index_col=0 ,parse_dates=True , sep=';' , dayfirst=True)
>>> np.round(es.tail())
              SX5P    SX5E   SXXP   SXXE   SXXF   SXXA    DK5F   DKXF  DEL
date
2016-09-28  2847.0  2991.0  343.0  324.0  408.0  350.0  9072.0  581.0  NaN
2016-09-29  2849.0  2992.0  343.0  324.0  408.0  351.0  9112.0  583.0  NaN
2016-09-30  2843.0  3002.0  343.0  325.0  408.0  350.0  9116.0  583.0  NaN
2016-10-03  2845.0  2998.0  343.0  325.0  408.0  351.0  9131.0  584.0  NaN
2016-10-04  2871.0  3030.0  346.0  328.0  411.0  354.0  9212.0  589.0  NaN
>>> del es['DEL']第二种导入方法
es2 = pd.read_csv(es_url, index_col=0 , parse_dates=True ,sep=';', dayfirst=True , header=None,skiprows=4 , names=cols)
es2.tail()
               SX5P     SX5E    SXXP    SXXE    SXXF    SXXA     DK5F    DKXF
2016-09-28  2846.55  2991.11  342.57  324.24  407.97  350.45  9072.09  581.27
2016-09-29  2848.93  2991.58  342.72  324.08  407.65  350.90  9112.09  582.60
2016-09-30  2843.17  3002.24  342.92  325.31  408.27  350.09  9115.81  583.26
2016-10-03  2845.43  2998.50  343.23  325.08  408.44  350.92  9131.24  584.32
2016-10-04  2871.06  3029.50  346.10  327.73  411.41  353.92  9212.05  588.71
vs = pd.read_csv ( './data/vs.txt' , index_col=0 ,parse_dates=True , sep=',' , header=2,dayfirst=True)
import datetime as dt
data = pd.DataFrame({'EUROSTOXX':es['SX5E'][es.index > dt.datetime(1999 ,1 ,1)]})
data = data.join(pd.DataFrame({'VSTOXX':vs['V2TX'][vs.index > dt.datetime(1999 ,1 ,1)]}))
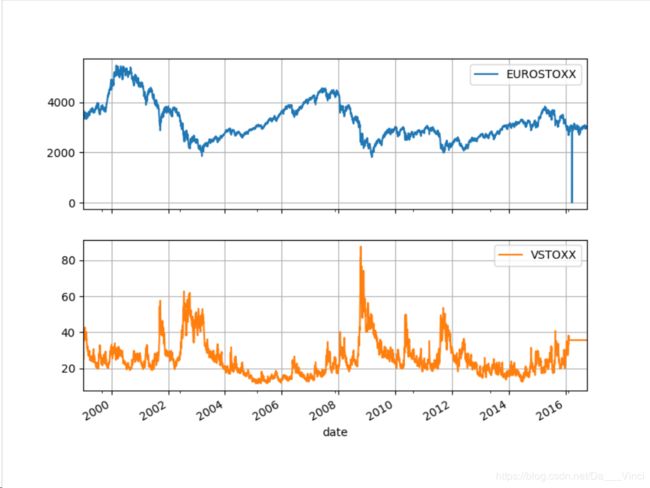
>>> data = data.fillna(method='ffill')data.plot(subplots=True,grid=True,figsize=(8,6))
array([,
],
dtype=object)
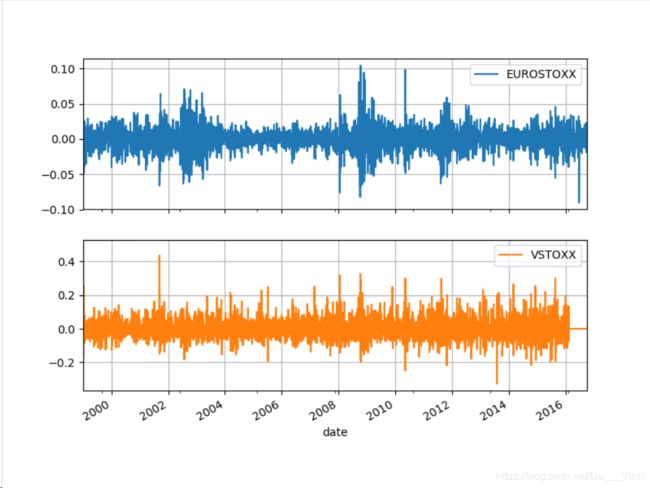
rets = np.log(data/data.shift(1))rets.head()
EUROSTOXX VSTOXX
date
1999-01-04 NaN NaN
1999-01-05 0.017228 0.489248
1999-01-06 0.022138 -0.165317
1999-01-07 -0.015723 0.256337
1999-01-08 -0.003120 0.021570>>> rets.plot(subplots=True,grid=True,figsize=(8,6))
array([,
],
dtype=object) 清除inf和nan
import statsmodels.api as sm
rets[np.isnan(rets)] = 0
rets[np.isinf(rets)] = 0
训练线性回归方程
X = sm.add_constant(rets['EUROSTOXX'])
y = rets['VSTOXX']
result = sm.OLS(y,X).fit()
result.summary()
"""
OLS Regression Results
==============================================================================
Dep. Variable: VSTOXX R-squared: 0.526
Model: OLS Adj. R-squared: 0.525
Method: Least Squares F-statistic: 5042.
Date: Thu, 14 Mar 2019 Prob (F-statistic): 0.00
Time: 16:11:28 Log-Likelihood: 8271.0
No. Observations: 4554 AIC: -1.654e+04
Df Residuals: 4552 BIC: -1.653e+04
Df Model: 1
Covariance Type: nonrobust
==============================================================================
coef std err t P>|t| [0.025 0.975]
------------------------------------------------------------------------------
const 4.945e-05 0.001 0.085 0.932 -0.001 0.001
EUROSTOXX -2.7539 0.039 -71.008 0.000 -2.830 -2.678
==============================================================================
Omnibus: 1298.505 Durbin-Watson: 2.084
Prob(Omnibus): 0.000 Jarque-Bera (JB): 24719.917
Skew: 0.875 Prob(JB): 0.00
Kurtosis: 14.279 Cond. No. 66.5
==============================================================================
总体相关参数
result.params
const        0.000049
EUROSTOXX   -2.753853
dtype: float64
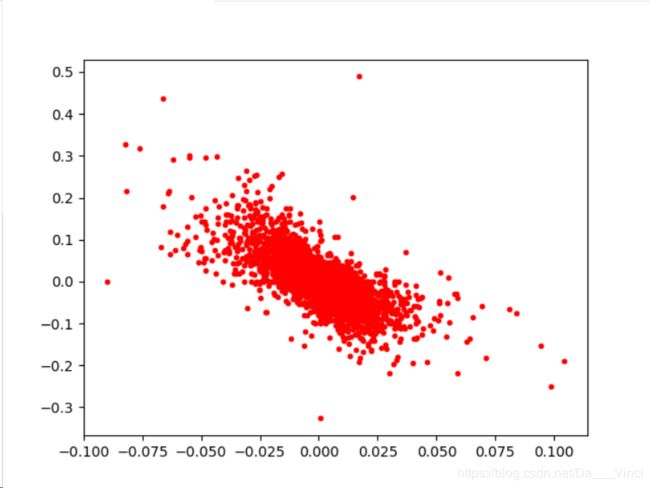
import matplotlib.pyplot as plt
plt.plot(rets['EUROSTOXX'],rets['VSTOXX'],'r.')
[] ax = plt.axis()
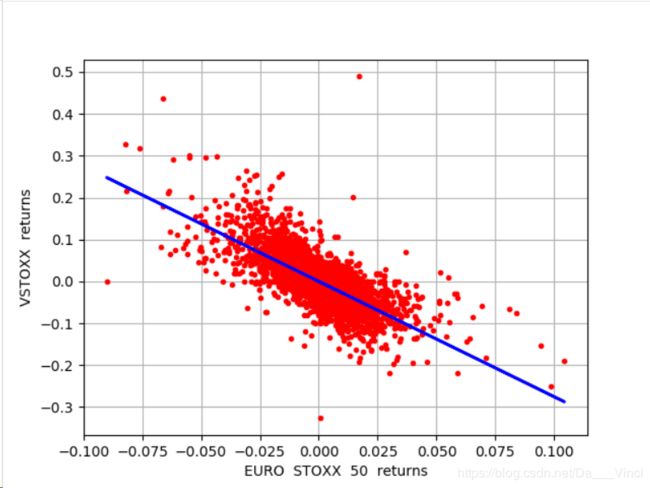
x = np.linspace(ax[0] ,ax[1] + 0.01)
plt.plot(rets['EUROSTOXX'],result.params.const+ result.params.EUROSTOXX*rets['EUROSTOXX'],'b',lw=2)
[]
plt.grid(True)
plt.axis('tight')
plt.xlabel('EURO STOXX 50 returns')
plt.ylabel('VSTOXX returns') 交叉检验
rets.corr()
           EUROSTOXX    VSTOXX
EUROSTOXX   1.000000 -0.724945
VSTOXX     -0.724945  1.000000
不同时期相关性
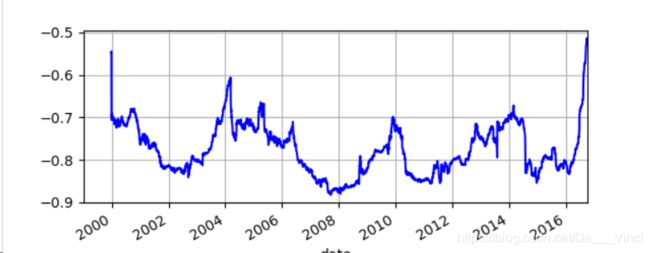
>>> rets['EUROSTOXX'].rolling(window= 252).corr(rets['VSTOXX']).plot(grid=True , style='b')


