【笔记】使用matplotlib进行绘图
导入并加载数据
import pandas as pd
% matplotlib inline
df_powerplant=pd.read_csv('powerplant_data_edited.csv')
绘制湿度的图
df_powerplant['Relative Humidity'].hist(figsize(8,8))  #直方图的尺寸
#df_powerplant['Relative Humidity'].plot(kind='hist')
df_powerplant['Relative Humidity'].plot(kind='pie') #饼状图
df_powerplant['Relative Humidity'].plot(kind='scatter') #散点图
df_powerplant['Relative Humidity'].plot(kind='bar') #柱形图
df_powerplant['Relative Humidity'].plot(kind='box')  #箱线
#df_powerplant['Relative Humidity'].value_counts() 显示每个唯一值的数量
*all变量之间的关系
pd.plotting.scatter_matrix( df_powerplant,figsize(15,15))
绘制温度与电力输出之间的关系图
df_powerplant.plot(x='Temperature',y='Electrical output',kind='scatter')
用 Matplotlib 创建柱状图
import matplotlib.pyplot as plt
% matplotlib inline
使用 pyplot 的 bar 函数
plt.bar([1, 2, 3], [224, 620, 425])

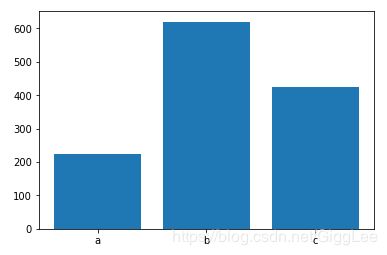
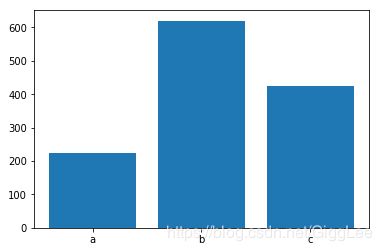
可以利用 pyplot 的 xticks 功能,或通过在 bar 功能中指定另一个参数,指定 x 轴刻度标签。以下两个框的结果相同。
#绘制条柱
plt.bar([1, 2, 3], [224, 620, 425])

#为 x 轴指定刻度标签及其标签
plt.xticks([1, 2, 3], ['a', 'b', 'c'])
#用 x 轴的刻度标签绘制条柱
plt.bar([1, 2, 3], [224, 620, 425], tick_label=['a', 'b', 'c']);
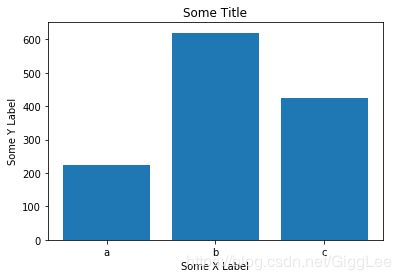
plt.bar([1, 2, 3], [224, 620, 425], tick_label=['a', 'b', 'c'])
plt.title('Some Title')
plt.xlabel('Some X Label')
plt.ylabel('Some Y Label');


